Download
1 / 2
20 likes | 27 Views
ERP solutions UAE employs visuals to turn complex data into usable insights, allowing users to make informed decisions and drive business success. Visualizations make data easier to understand, boost cooperation, and enable firms to respond quickly to changing market dynamics.

E N D
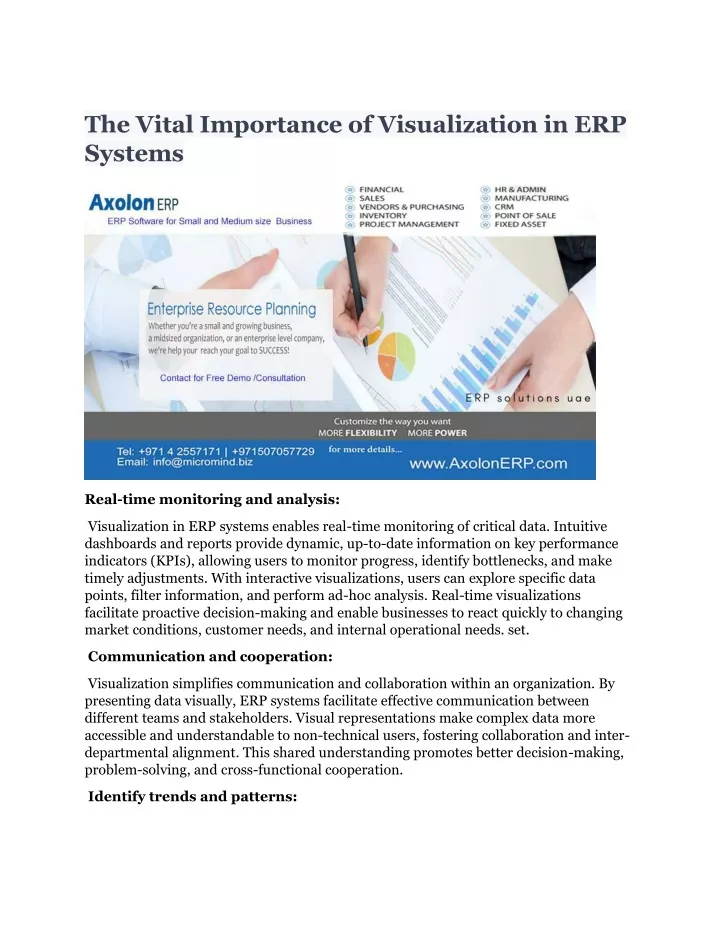
The Vital Importance of Visualization in ERP Systems Real-time monitoring and analysis: Visualization in ERP systems enables real-time monitoring of critical data. Intuitive dashboards and reports provide dynamic, up-to-date information on key performance indicators (KPIs), allowing users to monitor progress, identify bottlenecks, and make timely adjustments. With interactive visualizations, users can explore specific data points, filter information, and perform ad-hoc analysis. Real-time visualizations facilitate proactive decision-making and enable businesses to react quickly to changing market conditions, customer needs, and internal operational needs. set. Communication and cooperation: Visualization simplifies communication and collaboration within an organization. By presenting data visually, ERP systems facilitate effective communication between different teams and stakeholders. Visual representations make complex data more accessible and understandable to non-technical users, fostering collaboration and inter- departmental alignment. This shared understanding promotes better decision-making, problem-solving, and cross-functional cooperation. Identify trends and patterns:
ERP systems capture a wealth of data across different business functions. Visualization tools allow users to identify trends, patterns, and correlations in this data, providing valuable insights for strategic planning and forecasting. Visualization can reveal sales trends, demand patterns, inventory fluctuations, and other important factors that affect business performance. By identifying these patterns, organizations can predict market developments, adjust their strategies, and seize opportunities ahead of competitors. Visualizing trends and patterns enables businesses to make data-driven decisions to drive growth and maximize profits. User acceptance and interaction: User acceptance is an important factor for the success of an ERP system. Visualization improves user experience and engagement by presenting data in an engaging and interactive format. The intuitive and beautiful dashboard encourages users to explore data, experiment with different views, and extract meaningful insights. ERP solutions UAE employs visuals to turn complex data into usable insights, allowing users to make informed decisions and drive business success. Visualizations make data easier to understand, boost cooperation, and enable firms to respond quickly to changing market dynamics.