Download
1 / 4
40 likes | 45 Views
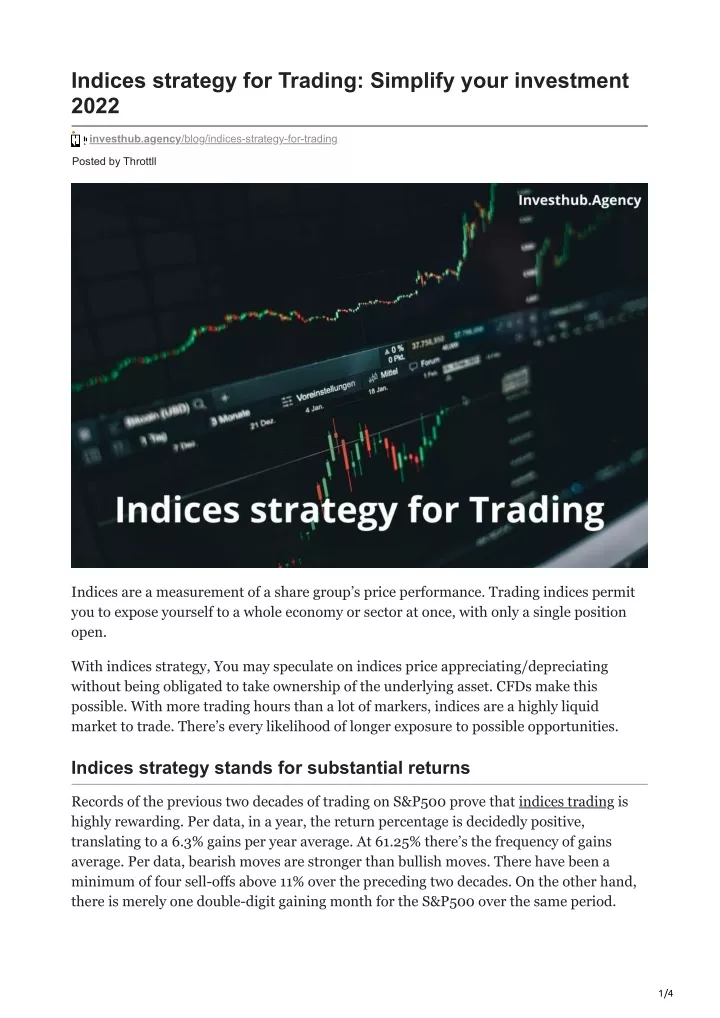
Indices are a measurement of a share groupu2019s price performance. Trading indices permit you to expose yourself to a whole economy or sector at once, with only a single position open. <br><br>With indices strategy, You may speculate on indices price appreciating/depreciating without being obligated to take ownership of the underlying asset. CFDs make this possible. With more trading hours than a lot of markers, indices are a highly liquid market to trade. Thereu2019s every likelihood of longer exposure to possible opportunities.

E N D
Indices strategy for Trading: Simplify your investment 2022 investhub.agency/blog/indices-strategy-for-trading Posted by Throttll Indices are a measurement of a share group’s price performance. Trading indices permit you to expose yourself to a whole economy or sector at once, with only a single position open. With indices strategy, You may speculate on indices price appreciating/depreciating without being obligated to take ownership of the underlying asset. CFDs make this possible. With more trading hours than a lot of markers, indices are a highly liquid market to trade. There’s every likelihood of longer exposure to possible opportunities. Indices strategy stands for substantial returns Records of the previous two decades of trading on S&P500 prove that indices trading is highly rewarding. Per data, in a year, the return percentage is decidedly positive, translating to a 6.3% gains per year average. At 61.25% there’s the frequency of gains average. Per data, bearish moves are stronger than bullish moves. There have been a minimum of four sell-offs above 11% over the preceding two decades. On the other hand, there is merely one double-digit gaining month for the S&P500 over the same period. 1/4
Stock markets do have innate trends. Indices are a vastly preferable instrument over the long term. This is true when we search for an asset to buy and hold. Uptrends are comparatively dependable, steady, and long-lasting. On the other hand, bearish moves are generally shorter, albeit more dramatic. Sharper periods of weakness do attract many. However, the continual wish to pick market tops will generally lead to anxiety. It is, therefore, more sensible to make use of indices’ bullish nature to trade with that trend instead of calling tops against the tops. Indices strategy for bullish indices Stocks appreciate more frequently than they depreciate, implying that a bullish long-term training strategy is reasonable. Reinvesting dividends adds a compounding effect where your account develops proportionally over time. When the stock undergoes ex-dividend, counteracting a share price drop, on a spread betting account you will get a dividend adjustment. Nonetheless, overnight charges imply that generally long holds will be more efficient thru a leveraged futures contract, or non-leveraged stock portfolio or ETF, which does. How do I trade indices? Or what is the best trade indices strategy? Or day trading indices strategy You may trade indices thru a CFD, ETF, option, or index future. They all have merits and demerits. Not a standardised exchange-listed instrument, a CFD is essentially a betting instrument offered for speculation in a given market. CFDs are important since they enable trading in micro-lot size. PrimeFin permits clients to trade CFD contract sizes from as low as GBP 1 per point on the FTSE 100 index. This permits the speculating without risking the sort of money index futures would need. As an indices strategy, CFDs disadvantage is that firms offering the CFDs have to make money off the price spread. Index Futures are index exchange traded, having an expiry date and thus the pricing includes a forward interest premium as well as a discounted dividend. Index CFDs are easier to understand, trading as they do at the spot price, not expiring. In this regard, ETFs do not have much over CFDs. 100 shares is a standard lot. Going beneath the standard lot size your trade would likely be routed to odd-lot dealers rather than directly handled thru regular channels. As an indices strategy, CFDs definitely make for more flexibility. A CFD or Contract for Difference refers to a pact or contract of exchange between seller and buyer that sets forth a condition in which the buyer has to pay the difference amount between the asset’s current value and contract value to the seller. Read more about the CFD trading guide. When to trade indices: best indices strategy 2/4
Professionals choose to trade during high volatility. This means the chosen market has just opened or it is about to close. Moreover, key economic data or global news events, like the US non-farm payrolls or interest rate announcements trigger above average volatility. How important is timing?: best indices strategy We like to think that we may profit from the news in case we act faster than others. That’s a fallacy. Anticipation moves the market. Buy the rumour, sell the fact. You would be broke if you every bit of press-published good news. The market reacts to the difference between the actual news and what had been the expectation. The unemployment rate could plummet 0.2 per cent, and the market declines since it expected a 0.4 percent drop. Action is not a signal for immediacy. When did the Fed lower interest rates? When did the market start responding? as far as interest rates go, it always takes more than one move by the Fed prior to there being a reaction. Admittedly, economic data and news events catalyse price movements. we do not have to analyse them to trade successfully. All such info is finally mirrored in the price chart as price action. Analysing price action does, however, tell you who is the main influencer. Those losing control – be they buyers or sellers – are also revealed. Index reversals thus become predictable, enabling you to make money. Reversal patterns: an important indices strategy Reversal patterns offer you an advanced warning when an index is most likely to turn around and start a new trend, and how far an index is potentially going to move in the direction opposite. Reversal patterns, while being quite fallible, do put the odds of success in your favour. There are two reversal patterns you have to be aware of: Double tops/bottoms; Head and shoulder tops/bottoms. Double tops/bottoms Double tops/bottoms form as an index price hits a support or resistance level two times prior to the index turning around, moving in the opposite direction. Bearish reversal patterns, double tops are the opposite number to double bottoms, which are bullish reversal patterns. When an index is in an upward trend, it will give a double top. When an index is in a downward trend, it will give a double bottom. Instructive indices strategy, that! 3/4
A or Resistance level A horizontal or slightly angled level of resistance; B or Support level A horizontal or slightly angled level of support ; C or Breakout point The point at which the index breaks up above the horizontal level of resistance -a triple bottom – or the point where the index breaks down below the horizontal level of support – a triple top; D or Price projection The price to which the index will potentially plummet following its breaking out of the triple top formation, or the price to which the index will potentially ascend following its breaking out of the triple bottom formation. The distance the index is projected to shift equals the distance between given airport and resistance levels. Head and shoulder tops/bottoms Head and shoulders tops are reversal patterns form as the price nudhes a resistance level – the first shoulder – subsequently breaking thru the first resistance level – forming the head – subsequently hitting the first resistance level again – the second shoulder. This indices strategy rewards your attentiveness. A or left shoulder A horizontal or slightly angled resistance level – head and shoulders top – or a horizontal/bit angled level of support -head and shoulders bottom; 4/4