Download
1 / 4
40 likes | 43 Views
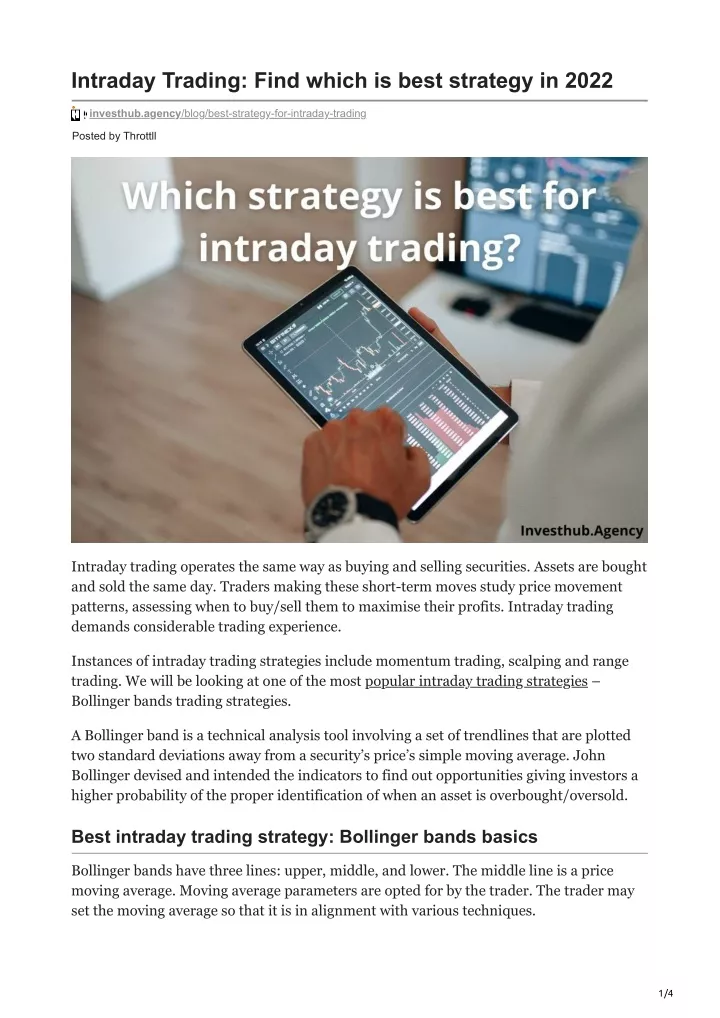
Intraday trading operates the same way as buying and selling securities. Assets are bought and sold the same day. Traders making these short-term moves study price movement patterns, assessing when to buy/sell them to maximise their profits. Intraday trading demands considerable trading experience.<br><br>Instances of intraday trading strategies include momentum trading, scalping and range trading. We will be looking at one of the most popular intraday trading strategies u2013 Bollinger bands trading strategies.

E N D
Intraday Trading: Find which is best strategy in 2022 investhub.agency/blog/best-strategy-for-intraday-trading Posted by Throttll Intraday trading operates the same way as buying and selling securities. Assets are bought and sold the same day. Traders making these short-term moves study price movement patterns, assessing when to buy/sell them to maximise their profits. Intraday trading demands considerable trading experience. Instances of intraday trading strategies include momentum trading, scalping and range trading. We will be looking at one of the most popular intraday trading strategies – Bollinger bands trading strategies. A Bollinger band is a technical analysis tool involving a set of trendlines that are plotted two standard deviations away from a security’s price’s simple moving average. John Bollinger devised and intended the indicators to find out opportunities giving investors a higher probability of the proper identification of when an asset is overbought/oversold. Best intraday trading strategy: Bollinger bands basics Bollinger bands have three lines: upper, middle, and lower. The middle line is a price moving average. Moving average parameters are opted for by the trader. The trader may set the moving average so that it is in alignment with various techniques. 1/4
The upper and lower bands are drawn on both sides of the moving average. Standard deviations decide the distance between the upper and lower band. The trader decides the number of standard deviations they would like the indicator to be set at. Nevertheless, there are many that use two standard deviations from the average. Going for a setting that is in alignment with techniques below, for the asset being traded, you will be shown a one-minute crude oil futures chart with Bollinger bands. Calculating Bollinger Bands : best intraday trading strategy For a particular data set, the standard deviation measures the extent to which numbers are spread out from an average value. Standard deviation may be arrived at by taking the variance’s square root. The latter itself is the average of the squared differences of the mean. You then have to multiply the given standard deviation value by two. You will be both adding and subtracting that amount from each point along the SMA. What do Bollinger bands indicate? Bollinger bands are extremely popular. Traders think that the closer the prices move to the upper band, the more overbought the market. Conversely, the closer the prices move to the lower band, the more oversold the market. You get an idea of the amount of motivation you will be asked to invest in the use of this indicator and associated best intraday trading strategy when we tell you there are 22 rules to follow when you use them! Distinctive features of best intraday trading strategy The best intraday trading strategy or the Bollinger Bands trading strategy has distinctive components – The Squeeze Bollinger bands revolve around the Squeeze. We call this a squeeze when the bands come close together, throttling the moving average. The latter signals a low volatility period. Traders believe a possible sign of future increased volatility, implying potential trading opportunities. On the other hand, the wider the bands move, the more likely the chance there’s a reduction in volatility, implying a greater possibility of a trade exit. Nonetheless, these conditions are not trading signals. The bands do not indicate when the change may occur, or the price movement direction ; Breakouts Close to 90% of price action takes place between the two bands. Therefore, a breakout above or below the band signifies an event of importance. The breakout, however, is no trading signal. Best intraday trading strategy: Bollinger bands, too, have limitations 2/4
No standalone trading system, Bollinger bands are not a standalone trading system. They are merely one indicator meant to offer traders information about price volatility. They must be used with a couple of non-correlated indicators providing more direct market signals. It is actually crucial to employ indicators based on diverse data types. John Bollinger Has Suggested you use MACD(Moving Average Convergence/Divergence), RSI(Relative Strength Index) and on-balance volume. Given that they are computed from a simple moving average, they weigh older price data at par with the most recent. The implication is that outdated data may dilute new info. Besides, 20 days SMA and 2 standard deviations are not exactly systematic. Traders ought to adjust their SMA and standard deviation assumptions, monitoring them regularly. Bolinger bands uptrends Bollinger bands aid in assessing how strongly an asset is ascending – the uptrend – and when the asset is possibly diminishing in strength or going into a reversal. All this can inform trading decisions. Following are guidelines for using Bollinger bands in an uptrend: When the price is in a strong uptrend, it will generally touch or run along with the upper band during impulse waves higher. In case that does not happen, the uptrend is likely losing momentum. During an uptrend, too, prices drop for periods of time. These are called pullbacks. If there is strong price movement during an uptrend, pullback lows will generally occur near or above the moving average/middle line. The pullback does not have to stall out near the middle line. Nonetheless, it is strong when it does. It ought not to touch the lower band when the price is in a strong uptrend. When it does, you have a reversal’s warning sign. Bollinger bands downtrends Bollinger bands aid in evaluating the degree to which an asset is declining – downtrend – and when the asset is possibly strengthening or reversing. The info may be employed to inform trading decisions. When the price is in a strong downtrend, it will generally touch or run along with the lower band during impulse waves heading lower. If it does not do that, the downtrend is losing momentum. During a downtrend, prices may rally for periods of time. This is the pullback. During a downtrend, if a price moves strongly lower, the pullback highs will generally take place bear or below the moving average – the middle – line. The pullback does not necessarily stall out near the middle line. However, it shows strength when it does. 3/4
It ought not to touch the upper band when the price is in a strong downtrend. When it does, you have a reversal. Bollinger bands trend reversals spotting Spot the reversals: When the price is in an uptrend and keeps on hitting the upper band – not the lower band – it could signal reversal commencement when the price hits the lower band. In the event of a price rallying again, it, in all likelihood, will not be reaching the upper band or the recent price high. When the price is in a downtrend and keeps hitting the lower band – not the upper band – the price hitting the upper band could signal that there’s a reversal commencement. When the price declines again, it, in all likelihood, will not be reaching the lower band or the recent price low. 4/4