Download
1 / 6
180 likes | 346 Views
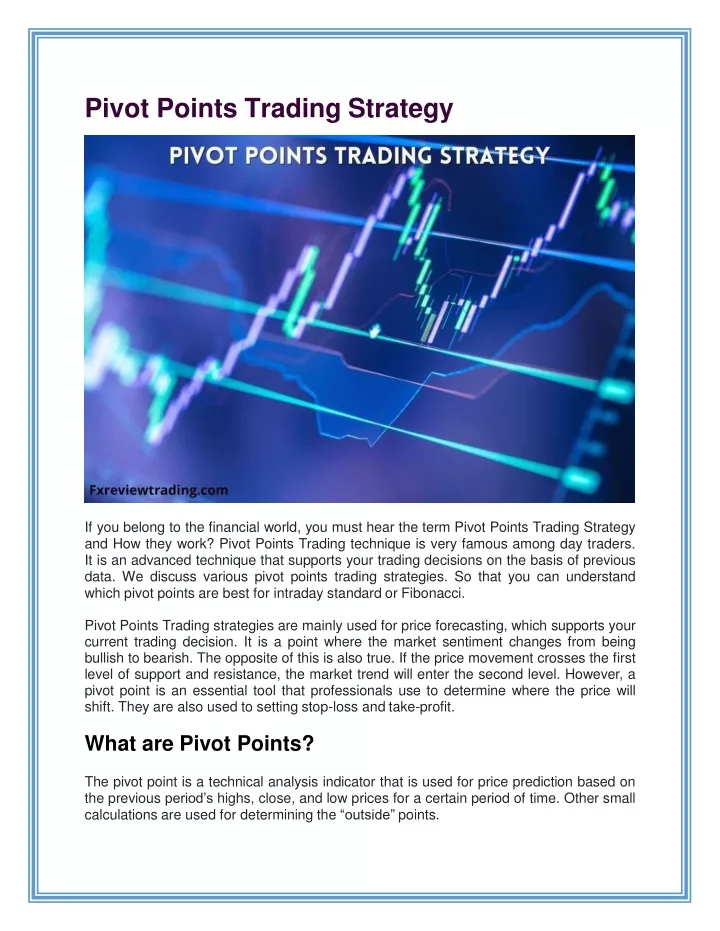
If you belong to the financial world, you must hear the term Pivot Points Trading Strategy and How they work? Pivot Points Trading technique is very famous among day traders. It is an advanced technique that supports your trading decisions on the basis of previous data. We discuss various pivot points trading strategies. So that you can understand which pivot points are best for intraday standard or Fibonacci.

E N D
Pivot Points TradingStrategy If you belong to the financial world, you must hear the term Pivot Points Trading Strategy and How they work? Pivot Points Trading technique is very famous among day traders. It is an advanced technique that supports your trading decisions on the basis of previous data. We discuss various pivot points trading strategies. So that you can understand which pivot points are best for intraday standard orFibonacci. PivotPointsTradingstrategiesaremainlyusedforpriceforecasting,whichsupportsyour current trading decision. It is a point where the market sentiment changes from being bullishtobearish.Theoppositeofthisisalsotrue.If thepricemovementcrossesthefirst level of support and resistance, the market trend will enter the second level. However, a pivot point is an essential tool that professionals use to determine where the price will shift. They are also used to setting stop-loss andtake-profit. What are Pivot Points? The pivot point is a technical analysis indicator that is used for price prediction based on thepreviousperiod’shighs,close,andlowpricesforacertainperiodof time.Othersmall calculations are used for determining the “outside”points.
It helps you to determine the entry and exit points of the market. That is why traders use pivotpointsasanindicatorwhichisusedtomanagesupportandresistancelevels.There are five resistance and support price levels available around thepivot. • Different Types of PivotPoints • There are four main types of pivot points, as explained below. • The Standard Pivot Points • Woodie PivotPoints • Camarilla PivotPoints • Fibonacci PivotPoints • Demark Pivot Points • As you start, you will see that there is often an eternal discussion between trades about the close, high, open and low prices due to the forex market being generally active 24 hronallweekdays.Collectdetailedinformationaboutallfourpivotpointsfromthisarticle. • Standard Pivot Points • The standard pivot points are intended in an easy way. The first thing you need to do is calculatethepivotpoint.Youcandeterminethisbyaddingthehigh,low,andclose.Then divide the total bythree. • Theinitialresistance(R1)isintendedbymultiplying2bythePPandsubtractingthelow (2*PP) – Low. The initial support (S1) is calculated through this formula (2*PP) –high. • The second support (S2) & second resistance (R2) are intendedby: • R2 = PP + (high – low) S2 = PP – (high –Low) • The third resistance & third support are intendedby: • R3 = Hgh + 2(PP- low) S3 = Low – 2(High –PP) • Woodie PivotPoints • The woodie pivot points are totally different from the classical and the standard pivot points. Some traders select these points because they give more importance to the previousperiod’sclosingprice.Thewoodiepilotpointiscalculatedwithadifferentformula mentionedbelow.
Firstly, calculate the pivot point (PP) by using the formula: (H+L+2C) /4. R1 = (2*PP) – Low S1 = (2*PP) –High R2 = PP +High – Low S2 = PP – High +Low Fibonacci PivotPoint The principle of Fibonacci Retracement is fundamental in the market. It is essential due to its remarkable performance for more than a century. It is also used for determining pivot points. Here are someformulas. First, you need to calculate the pivot point by the given formula: (H + L + C) / 3 The R1 is intended by PP + ((High – Low) *0.382). The S1 is intended by PP – ((High – Low) *0.382). The R2 is determined by PP + ((High – Low)* 0.618) The S2 is determined by PP – ((High – Low) x 0.618) The R3 is intended by PP + (( High – Low )* 1.000). The S3 is intended by PP – ((High – Low) x1.000). Camarilla PivotPoints Camarilla Pivot Points is not a popular pivot point in the market because it developed the principle of Fibonacci lines in the calculation. The tool’s calculation is comparatively longer than others. Check here the formula for calculating Camarilla PivotPoints. Firstly you need to add the high, low, and closing prices. After this, divide the total by 3. For determining the initialresistance R1 = Closing + ((High – Low)*1.0833) For calculating initial support, you need to do the reverse Closing – ((High – Low)*1.0833)
The exact formulas are applied for calculating further resistance andsupport. • Demark PivotPoints • DemarkPivotPointconsistsofauniquerelationshipbetweentheopeningandtheclosing price. Tom Demark developed this formula of calculating pivotpoints. • The demark pivot point utilizes the number Y for determining the upper resistance level and the lower level line. It also highlighted current price action. Here is the formula for calculating it with differentconditions. • 1st condition : Close > Open, In this case X = (2*High) + Low +Close • 2nd condition: Close < Open, In this case X = High + (2*Low) + Close 3rd condition: Close = Open, In this case X = High + Low + (2 * Close) Pivot Point =X/4 • R1 = X/2 – low S1 = X/2 –High • How do Pivot Pointswork? • Pivotpointoffersstandardsupportandresistancefunctionsmentionedonthepricechart. While price action comes nearer a pivot level, it canbe: • Extended(Breakout) • Supported/Resisted • Allthingsshouldbecheckedincasethepriceactioncomesnearertoapivotpointonthe price chart. You need to manage the condition as a general trading situation. However, if the costs begin fluctuating while reaching this level and coincidently turns towards the alternativedirection.Thenyouneedtotradeinthenewdirectionwhereitturns.Although, ifapivotpointdismissesthepriceaction,thenwecancontinuetheactioninthebreakout direction. This is known as pivot pointbreakout. • How can we perform Day trading through Pivot Points? • In the previous paragraph, we studied the basic concept of pivot points, and now we explain two pivot points trading strategies for day trading pivot level breakouts and pivot pointbounce.
Pivot Point BreakoutTrading To get entry in a pivot point breakout trade, you need to open a position by a stop-limit order while the price breaks via a pivot point level. These breakouts most take place in the morninghours. In case the breakout is beamish, then you will perform a short trade. Alternatively, suppose the breakout is bullish, then the performing trade will be a long trade. Do not forget to apply a stop loss while using pivot point breakout trading strategies. Must hold your pivot point breakout trade until the price level touches the next pivotlevel. Pivot Point BounceTrading It is also another type of pivot points trading strategy. In this pivot point strategy, in place of buying breakout, you can highlight the example while the cost action bounces from its levels. Suppose the stocks market is to examine the pivot line from upwards and also bounce upside; in this case, you can purchasestocks. Alternatively, Suppose the price is to examine a pivot line from the downwards and bouncesdownside;inthiscase,youneedtosellthestocks.Mustsetyourstop-lossorder above the pivot line in this trade if you are short. And keep the stop loss order below if you keep it for long. It is obvious that pivot point bounce trades will take place until the price touches the nextlevel. How to use Pivot Points Trading Strategies in the market? Till here we clear your all doughnuts about a pivot point, now it’s time to learn how to apply pivot point trading strategy in the market? But before that, you need to keep two things in your mind at the time of using pivot points trading strategiesare First thing, you can often apply a pivot points trading strategy while the market is fluctuating. This referred to the never apply pivot point strategy when the market is consolidating and ranging. The second thing, make sure that you set your aims carefully. Through this, you cankeepalittlebitdownwardstheresistancelevel,andalittlebitforwardsthe support levels. After going through these points, you need to select the correct pivot point suitable for yourtradingstyle.Checkherehowyoucanusethisatthetimeoftrading.Youonlyrequire a chart that you want to analyze and choose any one pivot point which you wish toapply, and three back pivots are sufficient in most cases. Only in a few instances, traders take more than three backpivots.
Now it’s time to select the number of levels of the points that you need to use. If the cost islocatedatthepivotpointlevel,youmaynotrequiresupportandresistance3andmore than that. Now, you can change the colour of the pivot points for spotting themquickly. For instance, take the EUR/USD forex pair; in the chart, add a standard pivot point along with any three back pivots. After that, add R1 S1 (first resistance & support ) and R2 S2 (second resistance & support ) levels. In this chart, you can easily see that the forex pair dropped and floated near to the first level of resistance and then rose again. During writing, the price is present at the pivot point level. However, if the price goes above this level, the next will see the resistance of the previouslevel.