Download
1 / 8
80 likes | 388 Views
Discover the same process we've use to evaluate each market, project, and product line we consider launching. <br><br>The reason why we've successfully entered 23 different niche markets, generating over $100 million in online revenue and over 52,000 subscribers per day across those markets - is because we have our market selection process almost down to a science. <br><br>See ALL OF MY TRAINING VIDEOS HERE: http://bit.ly/join-unfunnel.

E N D
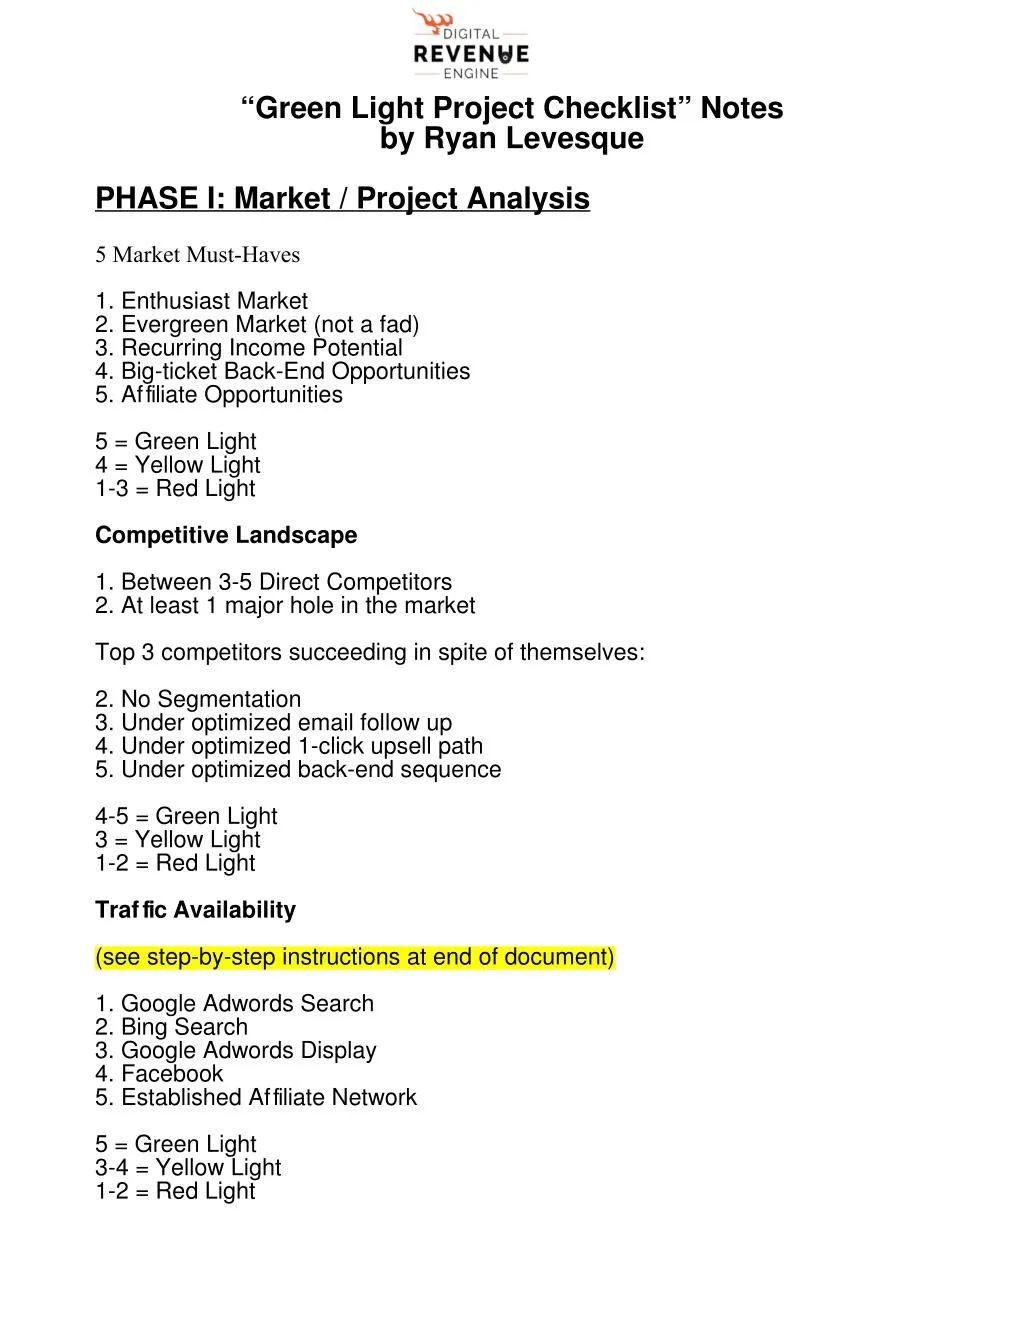
“Green Light Project Checklist” Notes by Ryan Levesque PHASE I: Market / Project Analysis 5 Market Must-Haves 1. Enthusiast Market 2. Evergreen Market (not a fad) 3. Recurring Income Potential 4. Big-ticket Back-End Opportunities 5. Affiliate Opportunities 5 = Green Light 4 = Yellow Light 1-3 = Red Light Competitive Landscape 1. Between 3-5 Direct Competitors 2. At least 1 major hole in the market Top 3 competitors succeeding in spite of themselves: 2. No Segmentation 3. Under optimized email follow up 4. Under optimized 1-click upsell path 5. Under optimized back-end sequence 4-5 = Green Light 3 = Yellow Light 1-2 = Red Light Traffic Availability (see step-by-step instructions at end of document) 1. Google Adwords Search 2. Bing Search 3. Google Adwords Display 4. Facebook 5. Established Affiliate Network 5 = Green Light 3-4 = Yellow Light 1-2 = Red Light
Scale Potential Assuming 3% CTR + 20% opt-in rate on Google Search + 0.5% CTR + 15% opt-in rate Google Display + 0.7 uCTR + 10% opt-in rate FB = Calculate this number MONTHLY, then divide by 30 Available Leads Per Day (Roughly): > 1000 = Green Light 500-999 = Yellow Light < 500= Red Light *Rationale = Assuming $50 front-end product, converting @ 5% of opt-ins: 1000 = 50 buyers * $50 = $2500/day = $75,000/month (* 5% = $3750) 500 = 25 buyers * $50 = $1250/day = $37,500/month (* 5% = $1875) 100 = 5 buyers * $50 = $250/day = $7,500/month PHASE II: Demand Analysis [Video timestamp 56:34] Deep Dive Survey (Search Traffic) > 10% Opt-In Conversion = Green Light 7-10% Opt-In Conversion = Yellow Light < 7% Opt-In Conversion = Red Light Deep Dive Answer Quality (Hyper-Responsives) > 300 = Green Light 100-300 = Yellow Light < 100 = Red Light PHASE III: Economic Analysis [video timestamp 1:03:45] *Actual Cost per Deep Dive Survey *Cut that number in half *Three assumptions:
5% sales to opt-in 7.5% sales to opt-in 10% sales to opt-in See what it will take to break even on front-end assuming your product price. e.g. Let’s say surveys cost you $5.00 each. Assume CPL will be $2.50. If you sell $50 product, you’ll need to convert @ 5% = Green Light If you sell $40 product, you’ll need to convert @ 6.25% = Yellow Light If you sell $20 product, you’ll need to convert @ 12.5% = Red Light Supplemental Material: Google Adwords Traffic Scale Potential Analysis: 1. Login to Google Adwords account, go to keyword planner
2. (37:09) Input direct market keywords – keywords where the person searching is directly looking for a solution to the problem that you're solving with your product. Then setup geo- targeting – where your target market lives (USA, for example). Set traffic estimate to monthly, then click on “get estimates”
3. Check for # of impressions: 4. So, given that we have estimated impressions of around 130,000... We take 130,000 (estimated impressions per month) x 3% (estimated click-thru rate) = 3900 potential clicks per month 3900 potential clicks per month x 20% (estimated opt-in rate) = 780 leads available per month
** Important ** Now, this is only for THREE main keywords. These impressions will increase when you add more “long tail” keywords (use your keyword planner to find these). Also, we've only selected to advertise in the US – so if you're planning on eventually selling your product outside the US, you should probably add other countries like the UK, Australia, Canada, NZ, etc to your search criteria. Google Display Traffic Scale Potential Analysis: 1. Login to Google Display Planner, and input your main keywords that your audience is interested in. Choose “Direct Response” as campaign type, US & English for campaign targeting, then click “Get Placement Ideas” 2. Next, get your monthly impression estimate:
We want to set impressions to “Monthly”, exclude irrelevant keywords, and then take a look at our total monthly impressions (#6 above). Apply the exclusions, subtracting the mobile traffic estimate (in this case 52%) and any gender-related exclusions (if you're only marketing to men or women). So base on our estimate of 500 million monthly “cookied” impressions, we'd get... 500,000,000 estimated monthly impressions x 50% (rough mobile traffic exclusion) = 250,000,000 monthly impressions 250,000,000 monthly impressions x 0.5% CTR (click thru rate) x 15% (opt-in rate) = 187,500 monthly opt-ins 187,500 monthly opt-ins / 30 = 6250 potential leads per day from Google Display [[[ NOTE: we forgot to do the mobile traffic exclusion in the video, which is why our estimate came out at 375,000 estimated monthly opt-ins Exclusions – you want to go in and exclude keywords that aren't directly a match for what you want to sell
Facebook Traffic Scale Potential Analysis: 1. Go into the Facebook “Power Editor” Apply criteria as shown above, giving you a “lookalike audience” of around 2 million (#5 above, exactly 2,010,500) 2,010,500 (lookalike audience) x 0.7% (uCTR – CTR for target audience) = 14,074 monthly clicks 14,074 monthly clicks * 10% opt-in rate = 1407 monthly opt ins / 30 = 47 estimated leads per day ESTIMATED TOTALS Leads per day, Google Adwords Leads per day, Google Display Leads per day, Facebook = 26 = 6250 = 47 TOTAL estimated leads per day = 6323 Based on Ryan's specific criteria, this market is a “Green Light” for scalability / volume


![The Ultimate Moving Checklist [Infographic]](https://cdn5.slideserve.com/10097304/slide1-dt.jpg)