Download
1 / 23
230 likes | 514 Views
Parametric Sensitivity Analysis For Cancer Survival Models Using Large-Sample Normal Approximations To The Bayesian Posterior Distribution. Gordon B. Hazen, PhD Northwestern University. Cancer survival models as components of many analyses.

E N D
Parametric Sensitivity Analysis For Cancer Survival Models Using Large-Sample Normal Approximations To The Bayesian Posterior Distribution Gordon B. Hazen, PhD Northwestern University
Cancer survival models as components of many analyses Col et al. (2002), “Survival impact of tamoxifen use for breast cancer risk reduction”, Medical Decision Making 22, 386-393.
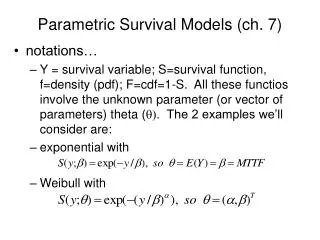
A simple cancer survival model – the Conditional Cure model p = probability of cure m = mortality rate if not cured Survival function:
Question • It is easy to choose p,m to fit a Conditional Cure survival curve to SEER survival data, but … • How should we conduct a sensitivity analysis on the resulting estimates
The Bayesian approach • Treat the unknowns p,m as random variables with specified prior distribution. • Use Bayes’ rule to calculate the posterior distribution of p,m given SEER or other data. • Use this posterior distribution to guide a sensitivity analysis, or to conduct a probabilistic sensitivity analysis.
Bayesian model with censoring • Posterior distribution • Posterior distribution is analytically awkward
Bayesian model with censoring Ovarian Cancer Stage II: Posterior on p,m
Bayesian model with censoring • Awkward analytical form makes the posterior distribution on p,m difficult to use for sensitivity analysis: • Where is a 95% credible region? • How to generate random p,m for probabilistic sensitivity analysis? • Solution: Large-sample Bayesian posterior distributions are approximately normal
Large-sample Bayesian posteriors • Fundamental result: For large samples, the Bayesian posterior distribution is approximately multivariate normal with • mean equal to the posterior mode (under a uniform prior, this is the maximum likelihood estimate) • covariance matrix equal to the matrix inverse of the Hessian of the log-posterior evaluated at the posterior mode.
Hessian of the log posterior The Hessian is the matrix of second partial derivatives with respect to p and m:
Large-Sample Bayesian Posteriors Using Excel’s Solver to calculate mle and covariance matrix for p,m. SEER data Hessian H Mle’s p,m covariance matrix Value of log posterior at p,m
Large-sample Bayesian posterior Ovarian Cancer Stage II True posterior density Approximate normal density
Two-way sensitivity analysis on p,m Vary p and m simultaneously two standard deviations along the principal component of the approximate normal posterior density.
Two-way sensitivity analysis on p,m (cont.) The resulting variation in stage II ovarian cancer survival:
Two-way sensitivity analysis on p,m(cont.) The resulting variation in survival for a 50-year-old white female with stage II ovarian cancer:
Summary • The Conditional Cure model for cancer survival. • A method for using a large-sample normal approximation to the Bayesian posterior distribution to guide a sensitivity analysis of parameter estimates for this model. • Appears to be a useful and practical method.
Potential Pitfalls • Large-sample normal approximation requires mle to be an interior maximum – estimates p = 0, p = 1, or m = 0 do not yield approximate normal posteriors • If sample size is very large, then posterior distribution will be so tight that sensitivity analysis is unnecessary.