Download
1 / 16
160 likes | 539 Views
According to a new market report published by Transparency Market Research “Photonic IC Market - Global Industry Analysis, Size, Share, Growth, Trends and Forecast, 2015 - 2022,” the photonic ic market was valued at US$0.19 bn in 2013, and is expected to reach US$1.3 bn by 2022, expanding at a CAGR of 25.3% from 2015 to 2022.

E N D
Transparency Market Research Photonic IC Market - Global Industry Analysis, Size, Share, Growth, Trends and Forecast, 2015 - 2022 Published Date 2015-11-13 125 Page Report Request Sample Buy Now Press Release Photonic IC Market Poised for Strong Growth, to Reach US$1.3 bn Globally by 2022
Photonic IC Market Transparency Market Research State Tower, 90, State Street, Suite 700. Albany, NY 12207 United States www.transparencymarketresearch.com sales@transparencymarketresearch.com REPORT DESCRIPTION According to a new market report published by Transparency Market Research “Photonic IC Market - Global Industry Analysis, Size, Share, Growth, Trends and Forecast, 2015 - 2022,” the photonic ic market was valued at US$0.19 bn in 2013, and is expected to reach US$1.3 bn by 2022, expanding at a CAGR of 25.3% from 2015 to 2022. Browse the full Photonic IC (Hybrid Integration, Monolithic Integration, and Module Integration) Market - Global Industry Analysis, Size, Share, Growth, Trends and Forecast, 2015 – 2022 report at http://www.transparencymarketresearch.com/photonic-integrated-circuit.html Cost and size reduction achieved by integrating different optical components, including detectors, modulators, and lasers, into a single distinct package is the major factor driving the photonic IC market. In addition, benefits offered in terms of efficiency, transfer speed, transmission capacity, and power consumption have ensured market penetration into varied end- use verticals such as metrology, aerospace and defense, healthcare, telecommunication, industrial, and data communication. Lack of digitization, coupled with design and packaging challenges related with the photonic integration, have inhibited the swift growth of photonic ICs. Commercialization of quantum computing (expected by 2018) is predicted to offer tremendous growth opportunities for the photonic IC market. photonic-integrated-circuit Three integration techniques deployed in photonic ICs include hybrid integration, monolithic integration, and module integration. Hybrid integration was the major integration technique used for photonic integration, accounting for 56.8% of the global market revenue in 2013. Although it is expected to remain the major integration technique over the forecast period, monolithic integration is expected to exhibit the maximum growth, growing at a CAGR of 26.5% during 2015– 2 Transparency Market Research
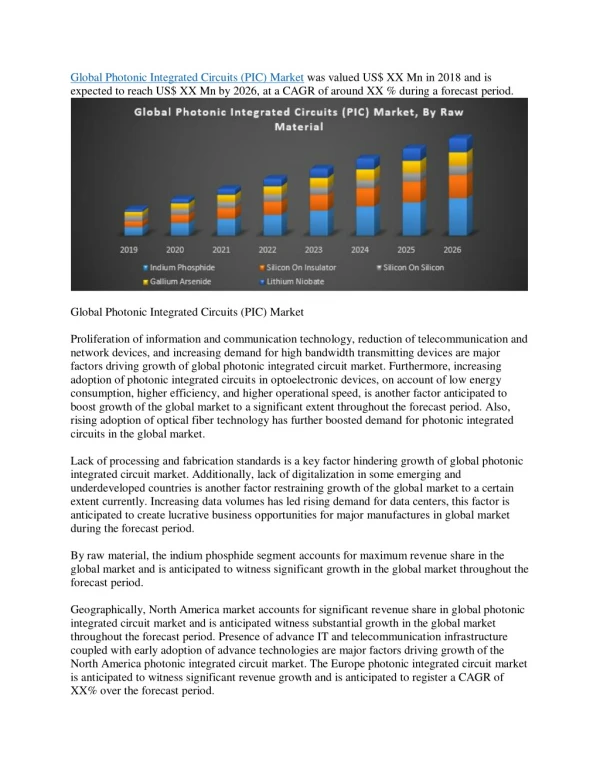
photonic IC market 2022. On the other hand, the module integration technique is expected to witness a fall in the revenues owing to its inferior integration capabilities as compared to hybrid and monolithic integration techniques. Indium phosphide and Silicon-on-Insulator collectively accounted for over half (60.9%) of the global market revenue in 2013. The dominance of indium phosphide is majorly on account of its ability to integrate opto-electronic functions into an optical system chip monolithically. In addition, the benefits offered in terms of size, speed, energy efficiency, and cost of fabrication and packaging have further ensured its dominance. Among different PIC components, lasers accounted for the majority of revenue share (29.3%) in the global photonic IC market in 2013. Optical amplifiers, which help in realizing high-level photonic integration by compensating for optical losses from individual photonic elements is expected to exhibit maximum growth, expanding at a CAGR of 26.6% over the forecast period from 2015 to 2022. Optical communications was the largest application segment in the photonic IC market, accounting for over half (58.6%) of the market revenue. It is expected to remain the largest application segment over the forecast period as a result of increasing demand from data center applications. Currently, sensing and biophotonics are the other major application segments, collectively accounting for around one-third (35.5%) of the global photonic IC market revenue. Although the current contribution from optical signal processing segment is the least, it is expected to witness healthy growth post commercialization of quantum computing. North America was the largest photonic IC market 2013, followed by Europe and Asia Pacific. Although North America is expected to remain the largest photonic IC market by 2022, Asia Pacific is expected to witness healthy growth, outpacing North America and Europe. The growth in Asia Pacific can be majorly attributed to growing demand from data center and biophotonics applications. The global photonic IC market is highly fragmented and is characterized by the presence of large number of players. Some of the leading players in the market include Infinera Corporation (the U.S.), Alcatel-Lucent S.A. (France), Huawei Technologies Co. Ltd (China), JDS Uniphase Corporation (the U.S.), Avago Technologies Ltd. (Singapore), Intel Corporation (the U.S.), and NeoPhotonics Corporation (the U.S.). The report studies the global PIC market, and provides estimates in terms of revenue (US$ Mn) from 2015 to 2022. Market estimates on the basis of integration type, raw materials, components, and application have also been provided for each region. The market has been segmented as follows: Photonic IC Market, By Integration Type Monolithic Integration 3 Transparency Market Research
photonic IC market Hybrid Integration Module Integration Photonic IC Market, By Raw Materials Indium Phosphide Gallium Arsenide Lithium Niobate Silicon Silicon-on-Insulator Others (Silica-On-Silicon, Silicon Dioxide (SiO2), Silicon Nitride (Si3Ni4)) Photonic IC Market, By Components Lasers Modulators Detectors Attenuators Multiplexers/De-Multiplexers Optical Amplifiers Photonic IC Market, By Application Optical Communication Fttx and Access Networks Microwave/RF Photonics Long-Haul and Transport Networks Optical Datacom 4 Transparency Market Research
photonic IC market Sensing Structural Engineering Chemical Sensors Transport and Aerospace Energy and Utilities Optical Signal Processing Optical Metrology Optical Instrumentation Quantum Optics Quantum Computing Biophotonics Medical Instrumentation Photonic Lab-On-A-Chip Analytics and Diagnostics Optical Biosensors Photonic IC Market, By Geography: North America Europe Asia Pacific Rest of the World (Latin America, Middle East and Africa) Request A Sample Of This Report: http://www.transparencymarketresearch.com/sample/sample.php? flag=S&rep_id=997 Table of Contents 5 Transparency Market Research
photonic IC market Chapter 1 Preface 1.1 Report Description 1.2 Research Scope 1.3 Research Methodology 1.3.1 Sources 1.3.2 Secondary Research 1.3.3 Primary Research 1.3.4 Models Chapter 2 Executive Summary 2.1 Market Snapshot: Global Photonic Integrated Circuit Market (2014 & 2022) 2.2 Global Photonic IC Market, By Integration Type, 2014 (US$ Mn) 2.3 Global Photonic IC Market, By Application, 2014 (US$ Mn) 2.4 Global Photonic IC Market, By Geography, 2014 (US$ Mn) Chapter 3 Global Photonic IC Market Analysis 3.1 Introduction 3.2 Photonic ICs vs. Electronic ICs 3.3 Market Trends and Future Outlook 3.3.1 Shift from Analog to Digital Mode 3.3.2 Integration with Electronic Components 3.4 Market Dynamics 3.4.1 Drivers 3.4.1.1 Miniaturization Leads to Cost Reduction 3.4.1.2 Increased Functionalities Leading to Growing Application Base 6 Transparency Market Research
photonic IC market 3.4.1.3 Growing Demand From Data Center Applications 3.4.1.4 High Power Efficiency 3.4.2 Restraints 3.4.2.1 Lack of Digitization 3.4.2.2 Design Issues in Large Scale Photonic Integration 3.4.3 Opportunities 3.4.3.1 Quantum Computing 3.5 Value Chain Analysis 3.6 Porter’s Five Forces Analysis 3.6.1 Bargaining Power of Suppliers 3.6.2 Bargaining Power of Buyers 3.6.3 Rivalry Among Existing Competitors 3.6.4 Threat of New Entrants 3.6.5 Threat from Substitute Products 3.7 Market Attractiveness Analysis, By Application, 2014 3.8 Global Photonic IC Market Analysis, By Integration Type, 2013 - 2022 (US$ Mn) 3.8.1 Hybrid Integration (Packaging Integration) 3.8.1.1 Global Hybrid Integration Photonic IC Market Revenue, 2013 – 2022 (US$ Mn) 3.8.2 Monolithic Integration 3.8.2.1 Global Monolithic Integration PIC Market Revenue, 2013 – 2022 (US$ Mn) 3.8.3 Module Integration 3.8.3.1 Global Module Integration Photonic IC Market Revenue, 2013 – 2022 (US$ Mn) 3.9 Global Photonic IC Market Analysis, By Raw Materials, 2013 - 2022 (US$ Mn) 3.9.1 Indium Phosphide (InP) 7 Transparency Market Research
photonic IC market 3.9.1.1 Global Indium Phosphide (InP) Photonic IC Market Revenue, 2013 – 2022 (US$ Mn) 3.9.2 Gallium Arsenide (GaAs) 3.9.2.1 Global Gallium Arsenide Photonic IC Market Revenue, 2013 – 2022 (US$ Mn) 3.9.3 Lithium Niobate (LiNbO3) 3.9.3.1 Global Lithium Niobate Photonic IC Market Revenue, 2013 – 2022 (US$ Mn) 3.9.4 Silicon (Si) 3.9.4.1 Global Silicon Photonic IC Market Revenue, 2013 – 2022 (US$ Mn) 3.9.5 Silicon-on-Insulator 3.9.5.1 Global Silicon-on-Insulator Photonic IC Market Revenue, 2013 – 2022 (US$ Mn) 3.9.6 Others (Silica-On-Silicon, Silicon Dioxide (SiO2), Silicon Nitride (Si3Ni4)) 3.9.6.1 Global Others (Silica-On-Silicon, SiO2, Si3Ni4) Photonic IC Market Revenue, 2013 – 2022 (US$ Mn) 3.10 Global Photonic IC Market Analysis, By Components, 2013 - 2022 (US$ Mn) 3.10.1 Lasers 3.10.1.1 Global Lasers Photonic IC Market Revenue, 2013 – 2022 (US$ Mn) 3.10.2 Modulators 3.10.2.1 Global Modulators Photonic IC Market Revenue, 2013 – 2022 (US$ Mn) 3.10.3 Detectors 3.10.3.1 Global Detectors Photonic IC Market Revenue, 2013 – 2022 (US$ Mn) 3.10.4 Attenuators 3.10.4.1 Global Attenuators Photonic IC Market Revenue, 2013 – 2022 (US$ Mn) 3.10.5 Multiplexers/De-Multiplexers 3.10.5.1 Global Multiplexers/De-Multiplexers Photonic IC Market Revenue, 2013 – 2022 (US$ Mn) 3.10.6 Optical Amplifiers 3.10.6.1 Global Optical Amplifiers Photonic IC Market Revenue, 2013 – 2022 (US$ Mn) 8 Transparency Market Research
photonic IC market 3.11 Global Photonic IC Market Analysis, By Applications, 2013 - 2022 (US$ Mn) 3.11.1 Optical Communications 3.11.1.1 Fttx and Access Networks 3.11.1.2 Microwave/RF Photonics 3.11.1.3 Long-Haul and Transport Networks 3.11.1.4 Optical Datacom 3.11.2 Sensing 3.11.2.1 Structural Engineering 3.11.2.2 Chemical Sensors 3.11.2.3 Transport and Aerospace 3.11.2.4 Energy and Utilities 3.11.3 Optical Signal Processing 3.11.3.1 Optical Metrology 3.11.3.2 Optical Instrumentation 3.11.3.3 Quantum Optics 3.11.3.4 Quantum Computing 3.11.4 Biophotonics 3.11.4.1 Medical Instrumentation 3.11.4.2 Photonic Lab-On-A-Chip 3.11.4.3 Analytics and Diagnostics 3.11.4.4 Optical Biosensors Chapter 4 North America Photonic IC Market Analysis 4.1 Overview 4.1.1 North America Photonic IC Market Revenue, 2013 – 2022 (US$ Mn) and Y-o-Y Growth (%) 9 Transparency Market Research
photonic IC market 4.2 North America Photonic IC Market Analysis, By Integration Type 4.2.1 North America Photonic IC Market Revenue for Hybrid Integration, 2013 – 2022 (US$ Mn) 4.2.2 North America Photonic IC Market Revenue for Monolithic Integration, 2013 – 2022 (US$ Mn) 4.2.3 North America Photonic IC Market Revenue for Module Integration, 2013 – 2022 (US$ Mn) 4.3 North America Photonic IC Market Analysis, By Application 4.3.1 North America Photonic IC Market Revenue, By Application, 2013 – 2022 (US$ Mn) 4.4 North America Photonic IC Market Analysis, By Raw Materials 4.4.1 North America Photonic IC Market Revenue, By Raw Materials, 2013 – 2022 (US$ Mn) 4.5 North America Photonic IC Market Analysis, By Components 4.5.1 North America Photonic IC Market Revenue, By Components, 2013 – 2022 (US$ Mn) 4.6 North America Photonic IC Market Analysis, By Countries 4.6.1 North America Photonic IC Market Revenue, By Countries, 2013 – 2022 (US$ Mn) Chapter 5 Europe Photonic IC Market Analysis 5.1 Overview 5.1.1 Europe Photonic IC Market Revenue, 2013 – 2022 (US$ Mn) 5.2 Europe Photonic IC Market Analysis, By Integration Type 5.2.1 Europe Photonic IC Market Revenue for Hybrid Integration, 2013 – 2022 (US$ Mn) 5.2.2 Europe Photonic IC Market Revenue for Monolithic Integration, 2013 – 2022 (US$ Mn) 5.2.3 Europe Photonic IC Market Revenue for Module Integration, 2013 – 2022 (US$ Mn) 5.3 Europe Photonic IC Market Analysis, By Application 5.3.1 Europe Photonic IC Market Revenue, By Application, 2013 – 2022 (US$ Mn) 5.4 Europe Photonic IC Market Analysis, By Raw Materials 5.4.1 Europe Photonic IC Market Revenue, By Raw Materials, 2013 – 2022 (US$ Mn) 5.5 Europe Photonic IC Market Analysis, By Components 10 Transparency Market Research
photonic IC market 5.5.1 Europe Photonic IC Market Revenue, By Components, 2013 – 2022 (US$ Mn) 5.6 Europe Photonic IC Market Analysis, By Region 5.6.1 Europe Photonic IC Market Revenue, By Region, 2013 – 2022 (US$ Mn) Chapter 6 Asia Pacific Photonic IC Market Analysis 6.1 Overview 6.1.1 Asia Pacific Photonic IC Market Revenue, 2013 – 2022 (US$ Mn) 6.2 Asia Pacific Photonic IC Market Analysis, By Integration Type 6.2.1 Asia Pacific Photonic IC Market Revenue for Hybrid Integration, 2013 – 2022 (US$ Mn) 6.2.2 Asia Pacific Photonic IC Market Revenue for Monolithic Integration, 2013 – 2022 (US$ Mn) 6.2.3 Asia Pacific Photonic IC Market Revenue for Module Integration, 2013 – 2022 (US$ Mn) 6.3 Asia Pacific Photonic IC Market Analysis, By Application 6.3.1 Asia Pacific Photonic IC Market Revenue, By Application, 2013 – 2022 (US$ Mn) 6.4 Asia Pacific Photonic IC Market Analysis, By Raw Materials 6.4.1 Asia Pacific Photonic IC Market Revenue, By Raw Materials, 2013 – 2022 (US$ Mn) 6.5 Asia Pacific Photonic IC Market Analysis, By Components 6.5.1 Asia Pacific Photonic IC Market Revenue, By Components, 2013 – 2022 (US$ Mn) 6.6 Asia Pacific Photonic IC Market Analysis, By Countries 6.6.1 Asia Pacific Photonic IC Market Revenue, By Countries, 2012 – 2022 (US$ Mn) Chapter 7 Rest of World Photonic IC Market Analysis 7.1 Overview 7.1.1 RoW Photonic IC Market Revenue, 2013 – 2022 (US$ Mn) 7.2 RoW Photonic IC Market Analysis, By Integration Type 7.2.1 RoW Photonic IC Market Revenue for Hybrid Integration, 2013 – 2022 (US$ Mn) 7.2.2 RoW Photonic IC Market Revenue for Monolithic Integration, 2013 – 2022 (US$ Mn) 11 Transparency Market Research
photonic IC market 7.2.3 RoW Photonic IC Market Revenue for Module Integration, 2013 – 2022 (US$ Mn) 7.3 RoW Photonic IC Market Analysis, By Application 7.3.1 RoW Photonic IC Market Revenue, By Application, 2013 – 2022 (US$ Mn) 7.4 RoW Photonic IC Market Analysis, By Raw Materials 7.4.1 RoW Photonic IC Market Revenue, By Raw Materials, 2013 – 2022 (US$ Mn) 7.5 RoW Photonic IC Market Analysis, By Components 7.5.1 RoW Photonic IC Market Revenue, By Components, 2013 – 2022 (US$ Mn) 7.6 RoW Photonic IC Market Analysis, By Region 7.6.1 RoW Photonic IC Market Revenue, By Region, 2013 – 2022 (US$ Mn) Chapter 8 Competitive Landscape 8.1 Market Positioning 8.1.1 Market Positioning of Photonic IC Market Players Chapter 9 Company Profiles 9.1 Infinera Corporation 9.2 Mellanox Technologies, Ltd. 9.3 Luxtera Inc. 9.4 Finisar Corporation 9.5 JDS Uniphase Corporation 9.6 NeoPhotonics Corporation 9.7 Alcatel-Lucent 9.8 Avago Technologies 9.9 M/A-COM Technology Solutions Holdings, Inc. 9.10 Aifotec AG 9.11 Ciena Corporation 12 Transparency Market Research
photonic IC market 9.12 Huawei Technologies Co., Ltd. 9.13 Intel Corporation 9.14 Oclaro, Inc. 9.15 Hewlett Packard 9.16 TE Connectivity Ltd 9.17 Enablence Technologies Inc 9.18 Agilent Technologies 9.19 Kaiam Corporation List of Figures FIG. 1 Market Segmentation: Global Photonic IC market FIG. 2 Global Photonic IC Market, By Integration Type, 2014 (US$ Mn) FIG. 3 Global Photonic IC Market, By Application, 2014 (US$ Mn) FIG. 4 Global Photonic IC Market, By Geography, 2014 (US$ Mn) FIG. 5 Price And Volume Trend of Biophotonics Chips, 2009 – 2014 FIG. 6 Value Chain Analysis FIG. 7 Porter’s Five Forces Analysis FIG. 8 Market Attractiveness Analysis, By Application, 2014 FIG. 9 Global Hybrid Integration Photonic IC Market Revenue, 2013 – 2022 (US$ Mn) FIG. 10 Global Monolithic Integration PIC Market Revenue, 2013 – 2022 (US$ Mn) FIG. 11 Global Module Integration Photonic IC Market Revenue, 2013 – 2022 (US$ Mn) FIG. 12 Global Photonic IC Market Revenue, By Raw Materials, 2014 and 2022 (%) FIG. 13 Global Indium Phosphide (InP) Photonic IC Market Revenue, 2013 – 2022 (US$ Mn) FIG. 14 Global Gallium Arsenide Photonic IC Market Revenue, 2013 – 2022 (US$ Mn) FIG. 15 Global Lithium Niobate Photonic IC Market Revenue, 2013 – 2022 (US$ Mn) 13 Transparency Market Research
photonic IC market FIG. 16 Global Silicon Photonic IC Market Revenue, 2013 – 2022 (US$ Mn) FIG. 17 Global Silicon-on-Insulator Photonic IC Market Revenue, 2013 – 2022 (US$ Mn) FIG. 18 Global Others (Silica-On-Silicon, SiO2, Si3Ni4) Photonic IC Market Revenue, 2013 – 2022 (US$ Mn) FIG. 19 Global Photonic IC Market Revenue Share, By Components, 2014 & 2022 (%) FIG. 20 Global Lasers Photonic IC Market Revenue, 2013 – 2022 (US$ Mn) FIG. 21 Global Modulators Photonic IC Market Revenue, 2013 – 2022 (US$ Mn) FIG. 22 Global Detectors Photonic IC Market Revenue, 2013 – 2022 (US$ Mn) FIG. 23 Global Attenuators Photonic IC Market Revenue, 2013 – 2022 (US$ Mn) FIG. 24 Global Multiplexers/De-Multiplexers Photonic IC Market Revenue, 2013 – 2022 (US$ Mn) FIG. 25 Global Optical Amplifiers Photonic IC Market Revenue, 2013 – 2022 (US$ Mn) FIG. 26 Global Photonic IC Market Revenue, By Application, 2014 and 2022 (%) FIG. 27 Global Photonic IC Market Revenue for Optical Communications Applications, 2013 – 2022 (US$ Mn) FIG. 28 Global Photonic IC Market Revenue for Sensing Applications, 2013 – 2022 (US$ Mn) FIG. 29 Global PIC Market Revenue for Optical Signal Processing Applications, 2013 – 2022 (US$ Mn) FIG. 30 Global Photonic IC Market for Biophotonics Application, 2013 – 2022 (US$ Mn) FIG. 31 North America Photonic IC Market Revenue, 2013 – 2022 (US$ Mn) and Y-o-Y Growth (%) FIG. 32 North America Photonic IC Market Revenue for Hybrid Integration, 2013 – 2022 (US$ Mn) FIG. 33 North America Photonic IC Market Revenue for Monolithic Integration, 2013 – 2022 (US$ Mn) FIG. 34 North America Photonic IC Market Revenue for Module Integration, 2013 – 2022 (US$ Mn) FIG. 35 Europe Photonic IC Market Revenue, 2013 – 2022 (US$ Mn) and Y-o-Y Growth (%) FIG. 36 Europe Photonic IC Market Revenue for Hybrid Integration, 2013 – 2022 (US$ Mn) FIG. 37 Europe Photonic IC Market Revenue for Monolithic Integration, 2013 – 2022 (US$ Mn) FIG. 38 Europe Photonic IC Market Revenue for Module Integration, 2013 – 2022 (US$ Mn) FIG. 39 Asia Pacific Photonic IC Market Revenue, 2013 – 2022 (US$ Mn) and Y-o-Y Growth (%) 14 Transparency Market Research
photonic IC market FIG. 40 Asia Pacific Photonic IC Market Revenue for Hybrid Integration, 2013 – 2022 (US$ Mn) FIG. 41 Asia Pacific Photonic IC Market Revenue for Monolithic Integration, 2013 – 2022 (US$ Mn) FIG. 42 Asia Pacific Photonic IC Market Revenue for Module Integration, 2013 – 2022 (US$ Mn) FIG. 43 RoW Photonic IC Market Revenue, 2013 – 2022 (US$ Mn) and Y-o-Y Growth (%) FIG. 44 RoW Photonic IC Market Revenue for Hybrid Integration, 2013 – 2022 (US$ Mn) FIG. 45 RoW Photonic IC Market Revenue for Monolithic Integration, 2013 – 2022 (US$ Mn) FIG. 46 RoW Photonic IC Market Revenue for Module Integration, 2013 – 2022 (US$ Mn) FIG. 47 Market Positioning of Photonic IC Market Players List of Tables TABLE 1 Market Snapshot: Global Photonic IC Market, 2014 & 2022 TABLE 2 Comparison Between Photonic ICs and Electronic ICs TABLE 3 Impact Analysis of Drivers TABLE 4 Impact Analysis of Restraints TABLE 5 Global Photonic IC Market Analysis, By Integration, 2014 and 2022 (US$ Mn) TABLE 6 North America Photonic IC Market Revenue, By Application, 2013 – 2022 (US$ Mn) TABLE 7 North America Photonic IC Market Revenue, By Raw Materials, 2013 – 2022 (US$ Mn) TABLE 8 North America Photonic IC Market Revenue, By Components, 2013 – 2022 (US$ Mn) TABLE 9 North America Photonic IC Market Revenue, By Components, 2013 – 2022 (US$ Mn) TABLE 10 Europe Photonic IC Market Revenue, By Application, 2013 – 2022 (US$ Mn) TABLE 11 Europe Photonic IC Market Revenue, By Raw Materials, 2013 – 2022 (US$ Mn) TABLE 12 Europe Photonic IC Market Revenue, By Components, 2013 – 2022 (US$ Mn) TABLE 13 Europe Photonic IC Market Revenue, By Region, 2012 – 2022 (US$ Mn) TABLE 14 Asia Pacific Photonic IC Market Revenue, By Application, 2013 – 2022 (US$ Mn) 15 Transparency Market Research
photonic IC market TABLE 15 Asia Pacific Photonic IC Market Revenue, By Raw Materials, 2013 – 2022 (US$ Mn) TABLE 16 Asia Pacific Photonic IC Market Revenue, By Components, 2013 – 2022 (US$ Mn) TABLE 17 Asia Pacific Photonic IC Market Revenue, By Countries, 2012 – 2022 (US$ Mn) TABLE 18 RoW Photonic IC Market Revenue, By Application, 2013 – 2022 (US$ Mn) TABLE 19 RoW Photonic IC Market Revenue, By Raw Materials, 2013 – 2022 (US$ Mn) TABLE 20 RoW Photonic IC Market Revenue, By Components, 2012 – 2022 (US$ Mn) TABLE 21 RoW Photonic IC Market Revenue, By Region, 2012 – 2022 (US$ Mn) About Us Transparency Market Research (TMR) is a global market intelligence company, providing global business information reports and services. Our exclusive blend of quantitative forecasting and trends analysis provides forward-looking insight for thousands of decision makers. TMR’s experienced team of Analysts, Researchers, and Consultants, use proprietary data sources and various tools and techniques to gather and analyze information. Our data repository is continuously updated and revised by a team of research experts, so that it always reflects the latest trends and information. With a broad research and analysis capability, Transparency Market Research employs rigorous primary and secondary research techniques in developing distinctive data sets and research material for business reports. Contact Mr. Atil Chaudhari 90 State Street, Suite 700 Albany, NY 12207 Tel: +1-518-618-1030 USA - Canada Toll Free: 866-552-3453 Email: atil@transparencymarketresearch.com Website: http://www.transparencymarketresearch.com/ 16 Transparency Market Research