Download
1 / 12
150 likes | 597 Views
Chapter 13 Analysing Quantitative Data. Zina O’Leary. Dealing with Data. Data interpretation is a major hurdle in any research study. Effective data analysis involves: keeping your eye on the main game managing your data engaging in the actual process of analysis

E N D
Chapter 13Analysing Quantitative Data Zina O’Leary
Dealing with Data • Data interpretation is a major hurdle in any research study. • Effective data analysis involves: • keeping your eye on the main game • managing your data • engaging in the actual process of analysis • and effectively presenting your data. Zina O’Leary (2009) The Essential Guide to Doing Your Research Project. London: Sage
“Doing” Stats • Being able to do statistics no longer means being able to work with formulae. • It is much more important for researchers to be familiar with the language and logic of statistics, and be competent in the use of statistical software. Zina O’Leary (2009) The Essential Guide to Doing Your Research Project. London: Sage
Data Management • Data management involves: • familiarizing yourself with appropriate software • systematically logging in and screening your data • entering the data into a programme • and ‘cleaning’ your data. Zina O’Leary (2009) The Essential Guide to Doing Your Research Project. London: Sage
Data Types • Different data types demand discrete treatment, so it’s important to be able to distinguish variables by: • cause and effect (dependent or independent) • and measurement scales (nominal, ordinal, interval, and ratio). Zina O’Leary (2009) The Essential Guide to Doing Your Research Project. London: Sage
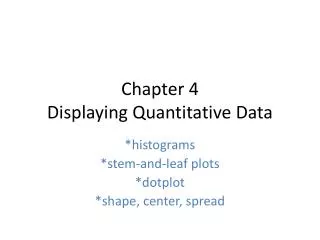
Descriptive Statistics • Descriptive statistics are used to summarize the basic feature of a data: • measures of central tendency (means, mode, and median) • dispersion (range, quartiles, variance, and standard deviation) • and distribution (skewness and kurtosis). Zina O’Leary (2009) The Essential Guide to Doing Your Research Project. London: Sage
Shape of the Data Areas under the Normal Curve So Zina O’Leary (2009) The Essential Guide to Doing Your Research Project. London: Sage
Inferential Statistics • Inferential statistics allow researchers to assess their ability to draw conclusions that extend beyond the immediate data, i.e.: • if a sample represents the population • if there are differences between two or more groups • if there are changes over time • or if there is a relationship between two or more variables. Zina O’Leary (2009) The Essential Guide to Doing Your Research Project. London: Sage
Statistical Significance • Statistical significance is captured through a ‘p-value’ - the probability that your findings are more than coincidence. • The lower the p-value, the more confident researchers can be that findings are genuine. Zina O’Leary (2009) The Essential Guide to Doing Your Research Project. London: Sage
Types of Analysis Statistical analysis can be: • Univariate - exploring one variable at a time • Bivariate - exploring the relationship between two variables • Multivariate - exploring the relationship between three or more variables. Multivariate analysis allows for the most sophisticated data interrogation. Zina O’Leary (2009) The Essential Guide to Doing Your Research Project. London: Sage
Selecting the Right Statistical Test • Selecting the right statistical test relies on knowing: • the nature of your variables • their scale of measurement • their distribution shape • and the types of question you want to ask. Zina O’Leary (2009) The Essential Guide to Doing Your Research Project. London: Sage
Data Presentation • Presenting quantitative data often involves the production of graphs and tables. • These need to be: • Selectively generated so that they make relevant arguments • Informative yet simple, so that they aid the reader’s understanding. Zina O’Leary (2009) The Essential Guide to Doing Your Research Project. London: Sage