Download
1 / 30
300 likes | 570 Views
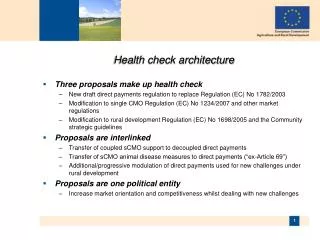
Health Data Check Overview. Pioneer Health Network. Jason Friesen, Executive Director. Pioneer Health Network. The Network was formed in 1995 and incorporated as a 509(a)(3) in 1997. 16 Hospitals (All county-owned except one)

E N D
Health Data CheckOverview Pioneer Health Network Jason Friesen, Executive Director
Pioneer Health Network • The Network was formed in 1995 and incorporated as a 509(a)(3) in 1997. • 16 Hospitals (All county-owned except one) • Largest are 99 & 87 Beds in counties of 35,000 and 20,000 respectively. • The others are Critical Access Hospital size in counties that average 3,500 population. • 11 members own long-term care services. • 13 own physician practices.
Health Data Check (HDC) Data from over 120 hospitals and 70 CAHs across the country Developed by rural hospitals for rural hospitals Currently includes operational, financial and productivity data. Project began in 1999
Why did we create our own program? These Programs have many disadvantages: • I’m a CAH, I can’t compare to a 99 bed hospital! • I have Long-Term care which changes my dynamics, do any of my peer group? • How do their operations allow for an average of 10 hrs per patient day less than mine? Who can I call to get some answers?
Health Data Check • As a Network: • You can share identities with each other. • Make hospital-to-hospital comparisons. • Learn directly from regional peers as to how they have obtained certain efficiencies. • Utilize current Network-based peer group forums to analyze the data.
Financial Benchmarks 1.Outpatient Revenue as a % of Total Patient Revenue 2.Gross Patient Revenue per Adjusted Patient Day 3.Net Patient Revenue per Adjusted Patient Day 4.Contractual % of Gross Patient Revenue 5.Bad Debt % of Net Patient Revenue 6.Labor Cost per paid Hour (exclude Providers) 7.Benefits as a % of Total Salaries and Wages 8.Supplies % of Net Patient Revenue 9.Gross Days in Accounts Receivable 10.Operating Margin: (All revenues except Non-Operating/Total Expenses) % 11.Tax Subsidies as a % of Operating Revenue 12.Total Margin: (All revenues/All expenses)% 13.Current Ratio: (Current Assets/Current Liabilities) 14.Unbilled Days in Accounts Receivables 15.Net Hospital Patient Revenue 16.Salaries as a % of Total Hospital Expense 17.Salaries as a % of Net Patient Service Revenue 18.Hospital Administrative Expense per Adjusted Patient Day 19.LTCU Average Cost per Day 20.LTCU Supplies Exp per Day 21.Clinic Salary Expense as a % of Gross Clinic Revenue 22.Clinic Supply Expense as a % of Gross Clinic Revenue
Statistical/Productivity • Adjusted Patient Days • Average Length of Stay - Acute • Total labor hours per APD (Adjusted Patient Day) • Hospital -Total Nursing hours per APD • Hospital -RN hours per APD • Hospital -Nurse Aid hours per APD • Hospital -LPN hours per APD • LTCU – Total Nursing hours per Patient Day • LTCU – RN hours per Patient Day • LTCU – Nurse Aid hours per Patient Day • LTCU – LPN hours per Patient Day • Clinic – Nursing hours per visit • Clinic- Business office hours per visit • Lab hours per Billed Test • Respiratory hrs per Billed Treatment • Dietary hrs per meal • Med Records hrs per APD • Radiology hrs per procedure • Housekeeping hrs per sq. ft. cleaned • Physical Therapy hrs per treatment • Business Office hrs per APD
deskHDC • Incident management software program. • Developed in partnership with Nevada Rural Hospital Partners (14-member hospitals). • Uploads data to web based application (webHDC) to provide aggregate reporting • Will add CAH specific quality indicators from 8th scope of work when released
deskHDC RiskManagement Program • The programis installed on the Risk Manager’scomputer. • The database is installed on your hospital’s computer network, with restricted access rights. • Report follow-up performed by the Risk Manager who has managerial rights in the system. • Departments within the hospital can add incident reports to the system.
deskHDC, Cont. • The Risk Manager can modify the incident report and access a follow-up/investigation option only available to them. • Incident information can be uploaded to webHDC for comparison purposes. • Note: physician, patient and other PHI is not uploaded. Individual hospitals are not identified in the report output.
deskHDC The application resides on your own hospital network
Imported from initial incident documentation Form printed within DeskQDC This document is completed by hand and returned to the Risk Manager The form is then filed and the information entered into the investigation form in DeskQDC Reviewer completes by writing in comments Standard of care is assigned to each person involved in the incident
The results of the investigation are entered into DeskQDC and saved
MAJOR CATEGORIES: SLIP/FALL PROCEDURE/TEST EQUIPMENT/SUPPLIES AMA/ELOPEMENT MEDICATION CARDIAC/RESPIRATORY ARREST INTRAVENOUS/BLOOD TRANSFUSION SECURITY/SAFETY COMPLAINTS SKIN INTEGRITY EMTALA SURGERY ANESTHESIA EMERGENCY DEPARTMENT OB/GYN/NURSERY MEDICAL/SURGICAL LONG TERM CARE HOME HEALTH/HOSPICE
A variety of report generating capabilities using Crystal Reports
Summary • Meet quality reporting requirements while maintaining relevance in a rural setting . • Manage your incidents in a consistent and efficient manner. • Use trending and reporting tools as a basis for staff education and programs to improve quality of patient care. • Tool developed with direct input from rural/CAH hospital staff.
Project Next Steps • Explore partnership opportunities with KHA/KDHE QHI system. • Make deskHDC and webHDC available to existing Health Data Check clients by 12/31/06 • Expand distribution of deskHDC and webHDC to other rural hospitals in calendar 2007 • Develop tool for measuring patient and employee satisfaction (Survey Data Check) by 12/31/06 • Develop means for consolidating data from all measurement tools in one location (Performance Data Check) by 12/31/06 • Integrate workman’s comp and infection control recording/reporting capabilities within deskHDC.
Survey Data Check (SDC) • Web based survey processing and reporting application • Measurement indicators for patient and employee satisfaction • Provide ability to upload data to PDC to produce dashboard reporting • Assess becoming an approved vendor for the consumer assessment of healthcare providers and systems ( CAHPS ) program and adding their survey indicators to SDC
Performance Data Check(PDC) Web based tool that provides the user a dashboard view of all data check applications and support for an organization’s balance scorecard (elements to be defined) • HDC – Operational and Financial Indicators • webHDC – web based Quality Indicators • deskHDC – local PC based Quality Indicators • SDC- Employee and patient satisfaction indicators
Contact Information Jason Friesen (620) 276-7700 jason@phn.org Mary Adam (620) 276-6100mary@phn.org