Download
1 / 11
130 likes | 638 Views
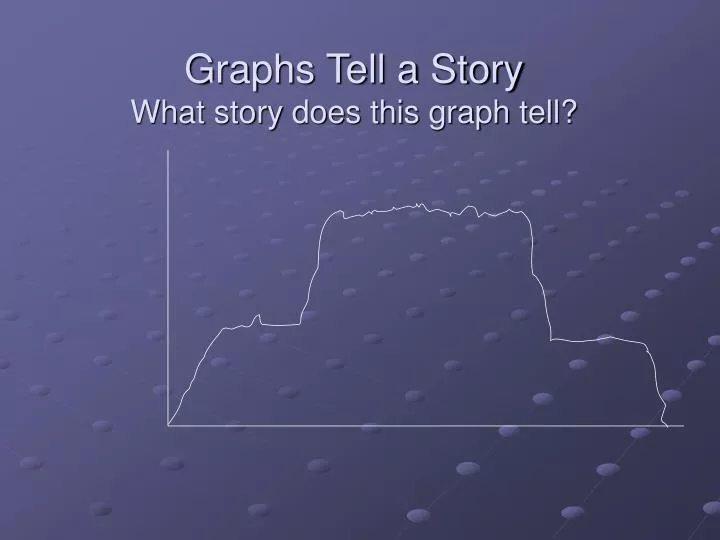
Graphs Tell a Story What story does this graph tell?. W hat story does this graph tell? – Without Labels and units , it is difficult to know the story…. Water Depth inches. Time minutes. Water level in a bathtub.

E N D
What story does this graph tell? – Without Labels and units, it is difficult to know the story…. Water Depth inches Time minutes
Water level in a bathtub It is also important to include a title to specifically describe what the data pertains to. Water Depth inches Time minutes
Your turn….. • Draw a graph of an event, and describe the event with words (write a story). • Include labels, units, and a title with your graph.
Shapes of graphs. • In nature, there are only a few basic graph shapes that describe many phenomenon such as gravity, light intensities, growth and decay rates, etc. • In this class, we will focus on four of these shapes of graphs. • In science, the objective of a graph is often to describe the relationship between the independent and dependent variables. • The relation between variables can be stated as an equation… The equation of the graphed line.
If the graph is not yet a line (linear), but is one of the simple shapes we will soon see, the graph can usually be made into a line by raising the independent variable ( the x-axis) to a power.
The Graph of a SquareOr graph of the independent variable raised to a power.
The Graph of an Inverse relationOr graph of the independent x-axis raised to the -1 power.
Determine the relation which the given data describes. • X Y • 1 • 4 • 9 • 17 • 26 • 36 • 50