Download
1 / 34
420 likes | 2.88k Views
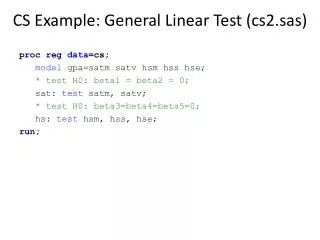
What do Test Scores Really Mean?. Rebecca Mann rlmann@purdue.edu. Why test?. School effectiveness Determine what students know and can do Compare student achievement to achievement of similar students Compare student ability level and achievement. Norm vs. Criterion Referenced.

E N D
What do Test Scores Really Mean? Rebecca Mann rlmann@purdue.edu
Why test? • School effectiveness • Determine what students know and can do • Compare student achievement to achievement of similar students • Compare student ability level and achievement
Norm vs. Criterion Referenced • Norm referenced • Comparing a person's score against the scores of a similar group who have taken the same exam, called the "norming group." • Examples • California Achievement Test (CAT) • Comprehensive Test of Basic Skills (CTBS) - "Terra Nova“ • Iowa Test of Basic Skills (ITBS) • Metropolitan Achievement Test (MAT) • WISC • Stanford-Binet • Bell Curve – all students cannot be above average!
Norm vs. Criterion Referenced • Criterion referenced • Measure how well a person has learned a specific body of knowledge and skills • Examples • ISTEP and most state exams • ITBS and Terra Nova • Driver’s License test • Content area placement exam (Algebra placement test) • Do not compare student to student
… THIS WEEK WE TOOK A TEST TO SEE IF WE’RE READY FOR THE TEST THAT TESTS OUR TEST SKILLS… … Wait until KINDERGARTEN
Ability vs. Achievement • Ability Test • Measure of cognitive ability • Child’s ability to learn • Achievement Test • Measure of what an individual has learned • There may be a discrepancy between ability and achievement scores • Underachievement • Learning Disability
Individual vs. Group Ability Tests • Individual intelligence testsare considered the most accurate measure of intelligence • Wechsler Intelligence Scale for Children (WISC-IV) • Wechsler Preschool & Primary Scale of Intelligence (WPPSI-III), • Stanford Binet (SB-5) • Woodcock-Johnson III (WJ-III) cognitive • Individual IQ tests must be given by a school or counseling psychologist.
Individual vs. Group Ability Tests • Group intelligence tests are commonly used as screening measures • Common group intelligence tests • Otis-Lennon School Ability Test - OLSAT • Cognitive Abilities Test – CogAT • IQ scores are not given on group tests
Group Achievement Tests • Criterion-referenced • Typically on grade level content, therefore difficult to know the level of mastery for a gifted child • Grade-level achievement tests are only a measure of basic skills • You cannot compare standard scores on achievement tests to IQ scores.
Will this be on the test?
Ceiling • The highest level of performance or score that a test can reliably measure • WISC-IV = 160 • Stanford-Binet IV = 165 • CogAT = 150 • OLSAT = 150
Standard Deviation • a statistical measure of spread • One standard deviation is the range which includes 65% of all scores, two standard deviations includes 95% of all scores
68% 96%
From Get Off My Brain, by Randy McCutcheon, illustrated by Pete Wagner
Types of Scores • Raw • Percentile Ranks • Grade Equivalent Scores • Standard Scale Scores
Raw Score • The number of items a student answers correctly • Allow students to be ranked, but they do not allow you to compare students
Percentile Rank • A percentile rank indicates the percentage of students in the same age or grade group whose scores fall below the score obtained by a particular student. • 99 is the highest percentile rank possible. • 50 is considered average • Deals with percentage of persons not percentage of items
Grade Equivalent Score • Most misinterpreted test score • If a 4th grader received a 7th grade equivalent score on a 4th grade reading achievement test, it DOES NOT mean the child is ready for 7th grade material. It means the child reads 4th grade material as well as the average 7th grader reads 4th grade material. • What is the test assessing???
Age Equivalent Score • Frequently misinterpreted • If a 10 year old received a 15 year old age equivalent score on a 4th grade reading achievement test, it DOES NOT mean the child is ready to tackle 10th grade material. It means the child reads material intended for 10 year olds as well as the average 15 year old reads it.
Stanine • Stanine is short for standard nine. The name comes from the fact that stanine scores range from a low of 1 to a high of 9. For instance, a stanine score of • 1, 2, or 3 is below average • 4, 5, or 6 is average • 7, 8, or 9 is above average • The stanine scale is a normalized standard score scale consisting of nine broad levels designated by the numbers one through nine. • Stanines are provided for both age and grade groups.
Standard Age Score • Raw Scores are converted to SAS based on chronological age • Used for interpretation purposes • Scale scores allow comparison of students • Somewhat akin to an IQ score • Uses means and standard deviation • Mean = 100
68% 96%
Standard scores • 130 and above Very Superior • 120-129 Superior • 110-119 High Average • 90-109 Average • 80-89 Low Average • 70-79 Borderline • 69 and below Impaired (Mentally Retarded range)
Standard Measure of Error • The range inside which an individual subject's future scores are expected to fall, based on her current score • The score +/- the standard measure of error is the estimated range in which the actual score lies • 130 +/- 5 means that the child’s true score is somewhere between 125 and 135
Confidence Interval • Using the standard measure of error • A range of values that indicates where the true score is likely to fall • Often expressed in 68%, 90%, or 95% • Such as: We can say with 68% confidence that a student’s true score is within this range. • The higher the confidence (95 instead of 68), the wider the range of scores
WISC-IV – 5rd grade boy • Verbal Comprehension: 150 • Perceptual Reasoning: 146 • Working Memory: 97 • Processing Speed: 88 • Full Scale IQ: 127
WISC-IV – 3rd grade boy • Verbal Comprehension: 110 • Perceptual Reasoning: 137 • Working Memory: 135 • Processing Speed: 112 • Full Scale IQ: 130
5th 3rd • Verbal Comprehension: 150 110 • Perceptual Reasoning: 146 137 • Working Memory: 97 135 • Processing Speed: 88 112 • Full Scale IQ: 127 130
http://www.hoagiesgifted.org/tests.htm • http://achieve.org/files/indiana_ISTEP_0.pdf