Download
1 / 11
110 likes | 326 Views
The relationship between meteorological conditions and air quality in Naples , Italy. Vincenzo Capozzi Ph.D Student in Marine, Earth and Climate Sciences Università degli studi di Napoli “Parthenope”. Goals/outline of the work. This work try to examine some relationship between

E N D
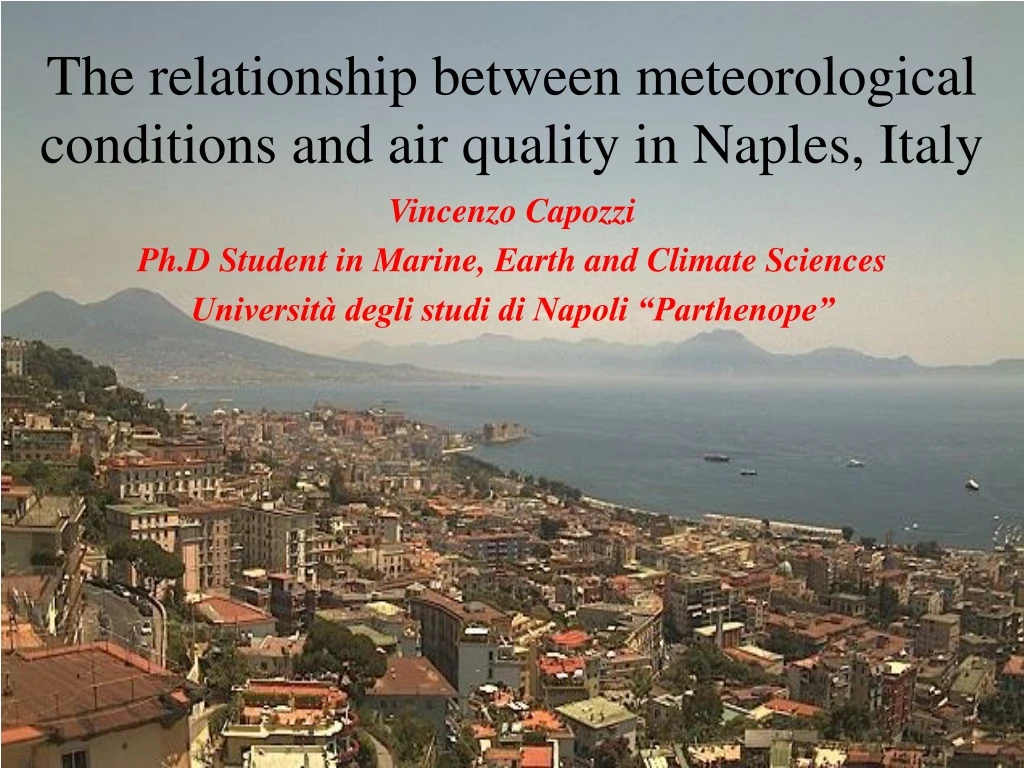
The relationshipbetweenmeteorologicalconditions and air quality in Naples, Italy Vincenzo Capozzi Ph.D Student in Marine, Earth and Climate Sciences Università degli studi di Napoli “Parthenope”
Goals/outline of the work This work trytoexamine some relationshipbetween meteorologicalconditions and pollutantsconcentrations in Naples. Motivation in the choiseofthistopic: the state of the atmosphere isone ofmainfactorsthatcontrols the finalconcentrationofpollutants in a site (Oke, 1987). The studyisfocused on threemainaspects: • Relationshipbetweenwind (speed and direction) and PM10 concentration (2002-2011 period); • Synoptic scale controlof PM10 levels (2002-2011 period); • RelationshipbetweenOzone (O3) concentration and solarradiation (2003-2011 period).
Relationship between wind conditions and pollutants concentration in Naples (1) • PM10 daily data wereretrievedfrom BRACE database (http://www.brace.sinanet.apat.it) and cover the 2002-2011 period, unfortunatelywithmanygaps. The air qualitymonitoringstationsused are: • Napoli Ente Ferrovie (40°51’13’’N 14°16’18’’E, 13 m asl), whichis part ofA.R.P.A.C.monitoringnewtork; • Napoli Scuola Vanvitelli (40°50’40’’N 14°13’41’’E, 190 m asl), whichis part ofA.R.P.A.C.monitoring network. • Wind daily data (speed and direction) cover the 2002-2011 period and wererecovered • fromtwoweather station: • Napoli Capodichino (40°51’45’’N 14°17’08’’E, 88 m asl), whichis part ofItalianMeteorological Service Network (www.meteoam.it); • Napoli Via Acton (40°50’14’’N 14°15’12’’E, 10 m asl), whichis part of the DiST (Dipartimento di Scienze e Tecnologie – Università di Napoli “Parthenope”) meteorological network.
Relationship between wind and pollutants concentration in Naples (2) y = 61.57*exp(-0.2187x) R2 = 0.14 y = 53.94*exp(-0.1836x) R2 = 0.13
Relationshipbetweenwind and pollutantsconcentration in Naples (3) Wind direction data were divided into 8 classes. For each class, PM10 concentration mean value for both air quality monitoring stations was computed.
Synoptic scale controlof PM10 levels (1) The map below was obtained from NCEP/NCAR Reanalysis (http://www.esrl.noaa.gov/psd/data/composites/day/) and shows the mean sea level pressure observed at synoptic scale in days characterized by a PM10 value in Naples (Ente Ferrovie station) below the 10th percentile. The map below was obtained from NCEP/NCAR Reanalysis (http://www.esrl.noaa.gov/psd/data/composites/day/) and shows the sea level pressure anomaly observed at synoptic scale in days characterized by a PM10 value in Naples (Ente Ferrovie station) below the 10th percentile. Good air quality events occur when a trough is formed over the Ionio Sea. In this situation winds from first and fourth quadrant prevail in the Campania Region and in Naples Gulf.
Synoptic scale control of PM10 levels (2) The map below was obtained from NCEP/NCAR Reanalysis (http://www.esrl.noaa.gov/psd/data/composites/day/) and shows the the sea level pressure anomaly observed at synoptic scale in days characterized by a PM10 value in Naples (Ente Ferrovie station) above the 10th percentile. The map below was obtained from NCEP/NCAR Reanalysis (http://www.esrl.noaa.gov/psd/data/composites/day/) and shows the mean Sea level pressure observed at synoptic scale in days characterized by a PM10 value in Naples (Ente Ferrovie station) above the 90th percentile. Poor air quality events occur when a ridge is formed over central-western Mediterranean basin. This situation results in weak pressure gradient and consequentely in low wind speed.
Relationship between Ozone concentration and solar radiation (1) • Ozonedailytimeserieswasreconstructedmeansof BRACE database (http://www.brace.sinanet.apat.it). In ordertohave a dataset as complete aspossible, two air qualitymonitoring station wereused: • Napoli Osservatorio Astronomico (40°51’46’’N 14°15’16’’E, 145 m a.s.l.), whichis a suburban station part ofA.R.P.A.C.monitoring network. • Napoli Ospedale Santobono (40°51’00’ N 14°13’ 51’’E, 173 m a.s.l.), whichis a urban station part ofA.R.P.A.C.monitoringnewtork. • DailySolarradiation data for the 2003-2011 periodwereretrievedfromIschia weather • Station(40°43’N 13°52’E, 104 m a.s.l.), whichis part of the DiST (Dipartimento di • Scienze e Tecnologie – Università di Napoli “Parthenope”) meteorological network.
Relationship between Ozone concentration and solar radiation (2) Daily Ozone concentration often exceed the 80 μg/m3 when the level of solar radiation topped 250 W/m2. y = 0.009963x + 39.76 R2 = 0.19 ρ = 0.43
Summary • Wind speed explains ≈ 15% of PM10 variance in Naples, according to the data recorded in 2002-2011 period; • daily PM10 concentration and wind speed show and inverse correlation (ρ ≈ -0.35). Both sites chosen for the analysis show the highest and the lowest daily PM10 value at the lowest wind speed (< 1 m/s); • mean daily concentration of PM10 is lower in both sites when the wind comes from the fourth quadrant (270-360°); • good air quality events in Naples occurr when a ciclonic circulation is present over the Ionio Sea, while poor air quality events occurr when a ridge is formed over central-western Mediterranean basin; • daily ozone concentration and solar radiation show a direct relationship (ρ = 0.43). Critical level of O3 concentration are often exceeded when solar radiation is above 250 W/m2.
References • Bercowicz, R., Palmgren, F., Hertel, O., Vignati, E. (1996), Using measurements of air pollution in streets for evaluation of urban air quality – meteorological analysis and model calculations, The Science of Total Environment, vol. 189/190, pp. 259-265. • Katsoulis, B.D. (1996), The relationship between synoptic, mesoscale and microscale meteorological parameters during poor air quality events in Athens, Greece, The Science of the Total Environment, vol. 181, pp 13-24. • Oke, T.R. (1987), Boundary layer climates, 2nd edn. Methuen, London. • Silva Junior, R. S. da, Oliveira, M. G. L. de, Andrade, M. de F. (2009), Weekend/weekday differences in concentrations of ozone, nox, and non-methane hydrocarbon in the metropolitan area of São Paulo. Rev. bras. Meteorol, vol.24, n.1, pp. 100-110. • http://www.brace.sinanet.apat.it • http://www.meteoam.it • http://www.tutiempo.net/en/Weather/Napoli_Capodichino/LIRN.htm