Download
1 / 27
280 likes | 765 Views
Visual Thinking. Rich Miller LexisNexis Research Scientist Alliances & New Technology richard.miller@lexisnexis.com. What is Visual Thinking?. An approach to understanding, creating, and communicating A collection of visually-based concepts and methods

E N D
Visual Thinking Rich Miller LexisNexis Research Scientist Alliances & New Technology richard.miller@lexisnexis.com
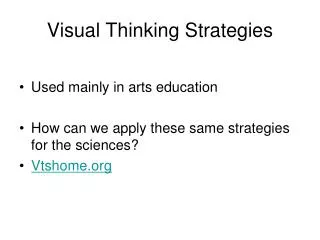
What is Visual Thinking? • An approach to understanding, creating, and communicating • A collection of visually-based concepts and methods • Information Visualization guidelines • Mindmaps • Sequential visual representations • What we can learn from Film and Comics • Vizability – cd/book on visual skills
Visual Thinking and “Aboutness” • General connection • Understanding what things are about • Communicating what things are about • Specific connection • Visualizations of index term collections • Result of visual thinking • Prime you to more visually process today’s information
Synonyms • visual thinking • Vizability • non-linear thinking • lateral thinking • spatial reasoning • right brain thinking
Who is it for? • Everyone who needs to imagine, resolve, invent, analyze, and communicate • UI designers, product managers, mathematicians, geneticists, writers, engineering students, etc. • Anyone who needs to formulate a problem and/or represent its solution to colleagues or users
Why is it useful? • To enhance performance in… • Thinking • Representing • Communicating • To create more compelling, usable products • Incorporating visualization into daily work can translate to superior products
InfoViz Guidelines • Tufte • Espouses “graphical excellence” using his principles • Hates “chart junk” • Anti-PowerPoint • Three landmark books • Offers excellent seminar • Presentation guidelines • Kosslyn • Psychology-based principles • Focus on limitations of human perceptual system • Others • Many companies creating product solutions • Ray Daley monitoring infoviz for LEXIS-NEXIS
Visualization Examples • Inxight hyperbolic tree • Criminal Intelligence – link analysis • Thinkmap – spider, bubble, chronology • Demo of answer set visualization
Sequential Art Concepts • Film • Borrow filmmaking techniques for UI design and visual representation. • Use pictures, time, and space to communicate • Example course • Comics • Similar techniques to film, but more discontinuous • Scott McCloud books • Understanding Comics – “must read” for web designers; recommended by Tufte • Reinventing Comics
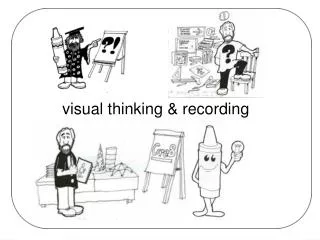
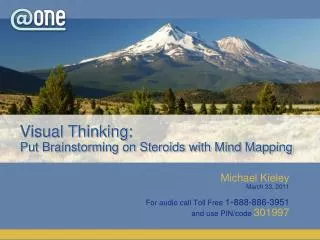
Mind Maps • Spatial/hierarchical representation of a given information space • A.k.a concept maps • Examples • Univ. of Zurich professor • Steve Gould from UK • Books • Mindmapping • The Mind Map Book
Vizability • Textbook + CD + sketchpad • Outgrowth of McKim book/course • Used at Stanford to teach ME students how to draw • Drawing can be taught…not as innate as one might think • To enhance performance in… • Thinking and Perceiving • Representing • Communicating
Vizability Goals • Familiarize you w/the visual culture • Make you aware of your own visual abilities • Exercise and improve your skills in visualization • Incorporate these skills into your daily life and professional activities
Vizability Benefits • Provides a methodology and awareness… • About problem finding and problem solving • About maintaining momentum on a task • About knowing how to sustain “flow experiences” -- productivity state between boredom and anxiety. • Get more out of your mind • By building fluid representational skills • More useful outputs • Idea logs • Whiteboard content • Pictures used for communication and reference
The cube metaphor • Six sides - 6 elements of visual culture • Environments • Culture • Seeing • Drawing • Diagramming • Imagining • Like a cube, the product is non-linear
Samples from the Vizability CD • Cast • Culture • Prototyping • Sketching • Idea logs • Environment • Seeing • Imagining • Drawing • Diagramming
Putting in into practice • Look more closely, and analyze what you see • When in doubt, draw a picture • Or ask someone to draw theirs • Borrow concepts from other forms of communication (e.g. film, comics) • Maximize rate of info transfer, minimize noise (e.g. PPT 3D feature) • Start your idea log • Feel free to contact me at… • richard.miller@lexisnexis.com
Memex Link Analysis return