Download
1 / 4
40 likes | 47 Views
We have more than 20 years of experience in designing, advising and implementing solutions as well as providing content and services for a wide repertoire of domestic and global clients across diverse sectors.

E N D
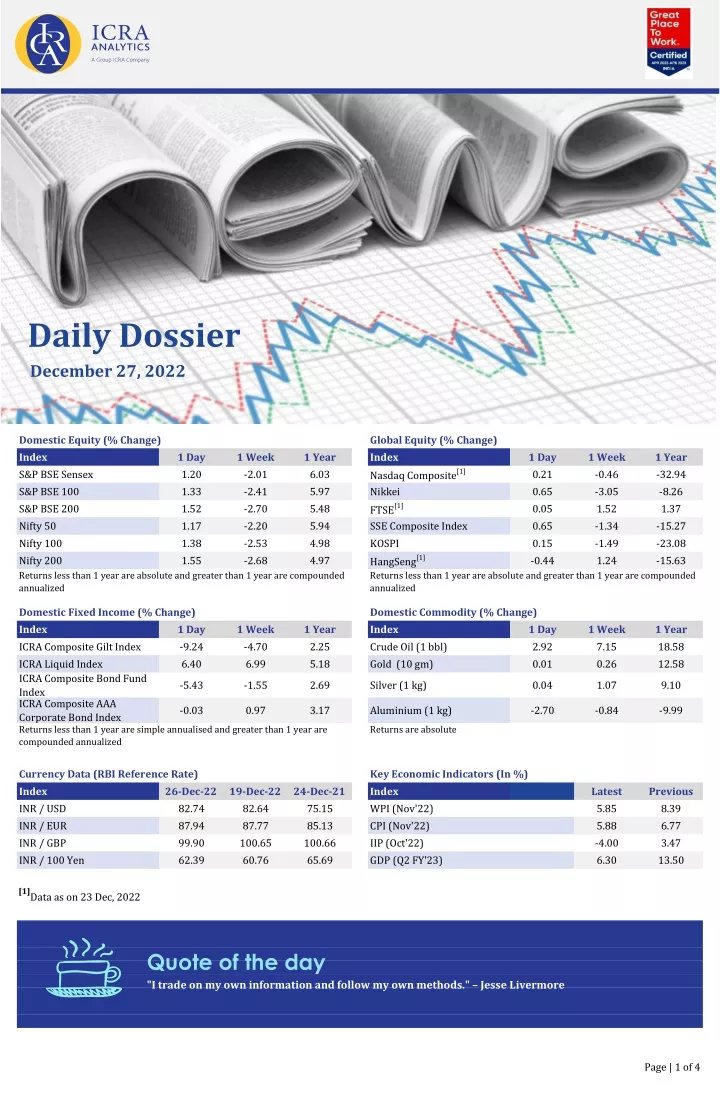
Daily Dossier December 27, 2022 Domestic Equity (% Change) Index S&P BSE Sensex S&P BSE 100 S&P BSE 200 Nifty 50 Nifty 100 Nifty 200 Returns less than 1 year are absolute and greater than 1 year are compounded annualized Global Equity (% Change) Index Nasdaq Composite[1] Nikkei FTSE[1] SSE Composite Index KOSPI HangSeng[1] Returns less than 1 year are absolute and greater than 1 year are compounded annualized 1 Day 1.20 1.33 1.52 1.17 1.38 1.55 1 Week -2.01 -2.41 -2.70 -2.20 -2.53 -2.68 1 Year 6.03 5.97 5.48 5.94 4.98 4.97 1 Day 0.21 0.65 0.05 0.65 0.15 -0.44 1 Week -0.46 -3.05 1.52 -1.34 -1.49 1.24 1 Year -32.94 -8.26 1.37 -15.27 -23.08 -15.63 Domestic Fixed Income (% Change) Index ICRA Composite Gilt Index ICRA Liquid Index ICRA Composite Bond Fund Index ICRA Composite AAA Corporate Bond Index Returns less than 1 year are simple annualised and greater than 1 year are compounded annualized Domestic Commodity (% Change) Index Crude Oil (1 bbl) Gold (10 gm) 1 Day -9.24 6.40 1 Week -4.70 6.99 1 Year 2.25 5.18 1 Day 2.92 0.01 1 Week 7.15 0.26 1 Year 18.58 12.58 -5.43 -1.55 2.69 Silver (1 kg) 0.04 1.07 9.10 -0.03 0.97 3.17 Aluminium (1 kg) -2.70 -0.84 -9.99 Returns are absolute Currency Data (RBI Reference Rate) Index INR / USD INR / EUR INR / GBP INR / 100 Yen Key Economic Indicators (In %) Index WPI (Nov'22) CPI (Nov'22) IIP (Oct'22) GDP (Q2 FY'23) 26-Dec-22 82.74 87.94 99.90 62.39 19-Dec-22 82.64 87.77 100.65 60.76 24-Dec-21 75.15 85.13 100.66 65.69 Latest 5.85 5.88 -4.00 6.30 Previous 8.39 6.77 3.47 13.50 [1]Data as on 23 Dec, 2022 Quote of the day "I trade on my own information and follow my own methods." – Jesse Livermore Page | 1 of 4
Daily Dossier December 27, 2022 Equity Nifty 50 and Put Call Ratio Movement Advance Decline Ratio NSE BSE 18,486 1.03 Advance 1,924 2,858 18,226 0.91 Put/ Call Nifty 50 Decline 366 785 17,966 0.80 Unchanged 58 125 17,706 0.68 20-Dec-22 22-Dec-22 Nifty 50 Spot Index 24-Dec-22 26-Dec-22 Put Call Ratio Institutional Flow - Equity (₹ Cr.) Institutional Flow - Debt (₹ Cr.) Purchase 3,479 488 5,339 Sales 4,357 152 4,053 Net -878 336 1,286 Purchase 125 586 Sales 129 272 Net -4 314 FII Flows MF Flows** DII Flows ** Data as on Dec 22, 2022 FII Flows MF Flows** Indian equity markets started the week with strong gains snapping four days of losing streak followed by the supportive global cues after U.S. inflation declined in November 2022. Further, investors also opted for bargain hunting after the recent decline due to recessionary worries and COVID situation across the globe. A stronger rupee against the greenback also contributed to the upside. • Key benchmark indices S&P BSE Sensex and Nifty 50 gained 1.2% and 1.17% to close at 60,566.42 and 18,014.60 respectively. • The overall market breadth on BSE was strong with 2,858 scrips advancing and 785 scrips declining. A total of 125 scrips remained unchanged. • Debt G-Sec Yield Vs. Debt Market Traded Volume Liquidity Indicators (₹ Cr.) 26-Dec-22 23-Dec-22 24-Dec-21 G-Sec LAF T-Bill Call T-Repo 11,497 NA 3,456 10,140 405,808 27,311 NA 3,239 10,870 397,532 27,733 -93,955 1,780 10,699 393,955 8.00 64,556 Traded Volume 7.67 47,711 G-Sec Yield 7.33 30,866 7.00 14,021 29-Nov-22 08-Dec-22 10 Yrs G-Sec 17-Dec-22 26-Dec-22 Traded Volume Policy Rates (in %) Top 5 traded G - Sec(26 Dec 2022) Closing Yield 7.32 7.23 7.42 7.44 7.31 Change in BPS 0 1 1 1 1 Volume (Rs. Cr.) 4,984 1,300 1,150 940 346 26-Dec-22 19-Dec-22 24-Dec-21 Security Reverse Repo Repo CRR SLR Bank Rate 3.35 6.25 4.50 18.00 6.50 3.35 6.25 4.50 18.00 6.50 3.35 4.00 4.00 18.00 4.25 07.26 GS 2032 07.38 GS 2027 07.41 GS 2036 07.54 GS 2036 07.10 GS 2029 Bond yields closed steady due to lack of domestic triggers. Market participants preferred to remain on the side-lines ahead of the end of the calendar year. • Yield on the 10-year benchmark paper (7.26% GS 2032) closed unchanged at 7.32%, same as that of the previous day’s close. • [1]Data as on 23 Dec, 2022 Page | 2 of 4
Daily Dossier December 27, 2022 Commodity and Currency Global Commodity Category Gold ($/oz) Silver ($/oz)[1] NYMEX Crude($/bbl)[1] Brent Crude($/bbl)[1] Baltic Dry Index[1] Movement of USD/INR with Domestic Gold prices Rupee Vs. Gold Current 1,797.61 23.70 79.47 84.03 1,515.00 Prev Day 1,797.91 23.57 77.53 82.82 1,650.00 % Change -0.02 0.56 2.50 1.46 -8.18 54,689 Gold (in Rs.) 84 Rupee per USD 52,191 80 49,693 76 47,195 72 28-Dec-21 28-Apr-22 Gold (Rs.) 27-Aug-22 USD/INR 26-Dec-22 Gold prices closed steady due to lack of market triggers. • The Indian rupee rose against the U.S. dollar tracking positive cues from domestic equity market and the weakening of U.S. dollar index in the overseas market. • Mutual Fund Equity Category Large Cap Fund Mid Cap Fund Multi Cap Fund Aggressive Hybrid Fund Small Cap Fund Debt Category Liquid Fund Ultra Short Duration Fund Short Duration Fund Long Duration Fund Gilt Fund 1 Year 3.57 3.53 4.55 3.63 2.38 3 Years 13.56 22.10 19.13 13.34 29.72 5 Years 9.82 10.43 11.58 9.01 11.26 1 Month 6.34 6.08 5.49 4.00 4.16 6 Months 5.61 5.24 5.90 9.88 6.38 1 Year 4.72 4.24 4.33 1.69 2.33 Note: 1. Equity: Less than 1 year return are absolute and greater than 1 year returns are CAGR; 2. Debt: Less than 1 year return are simple annualised and greater than 1 year returns are CAGR; 3. Category as per MFI Explorer Mutual funds bought equity worth Rs. 488.10 crore as against sale of Rs. 152.05 crore as on Dec 22, 2022. This led to a net purchase of Rs. 336.05 crore compared with a net purchase of Rs. 1212.52 crore on Dec 21, 2022. • Mutual funds bought debt worth Rs. 585.58 crore as against sale of Rs. 271.68 crore as on Dec 22, 2022. This led to a net purchase of Rs. 313.90 crore compared with a net purchase of Rs. 690.79 crore on Dec 21, 2022. • Event Calendar Events for December 2022 Event Event Date Date Reserve Money Money Supply Forex Reserves Credit Growth 28-Dec-22 28-Dec-22 30-Dec-22 30-Dec-22 Deposit Growth Infrastructure Output Fiscal deficit (as a % of budget estimates) Loans and Advances to Central Government 30-Dec-22 30-Dec-22 30-Dec-22 30-Dec-22 Note: All the data of the newsletter are sourced from MFI Explorer, BSE, CCIL, MCX, NSDL, NSE, RBI, SEBI, Refinitiv [1]Data as on 23 Dec, 2022 Page | 3 of 4
Daily Dossier December 27, 2022 Other Offerings MFI Explorer Complete fund analytics on your desktop MFI Portfolio Tracker Accurate portfolio valuation and return computation for mutual fund portfolios Factsheet and Scorecard Comprehensive performance statistics and fund details Product Note Everything about a fund explained in a lucid and visually appealing manner Newsletter Periodic updates from global and domestic capital markets Datafeed and Web tool Exhaustive data sets to power your system and array of calculators for your portal Contact Us Atul Sharma Saugat Acharya +91 96191 12544 +91 98209 74940 atul.sharma@icraanalytics.com saugat.acharya@icraanalytics.com Ashwini Kumar (Head - Market Data) Eshna Basu +91 98202 41005 +91 96747 11671 ashwini.kumar@icraanalytics.com eshna.basu@icraanalytics.com Disclaimer: All information contained in this document has been obtained by ICRA Analytics Limited from sources believed by it to be accurate and reliable. Although reasonable care has been taken to ensure that the information herein is true, such information is provided ‘as is’ without any warranty of any kind, and ICRA Analytics Limited in particular, make no representation or warranty, express or implied, as to the accuracy, timeliness or completeness of any such information. All information contained herein must be construed solely as statements of opinion, and ICRA Analytics Limited shall not be liable for any losses incurred by users from any use of this document or its contents in any manner. Opinions expressed in this document are not the opinions of ICRA Analytics Limited’s holding company, ICRA Limited (ICRA), and should not be construed as any indication of credit rating or grading of ICRA for any instruments that have been issued or are to be issued by any entity. Readers are requested to click here for ICRA Analytics disclaimer ‐ https://icraanalytics.com/home/Disclaimer Page | 4 of 4