Download
1 / 7
70 likes | 74 Views
Automated Data Management and Personalized Insights, empowering ad sales and operations to make quick, confident decisions. Learn More: https://www.burtintelligence.com/

E N D
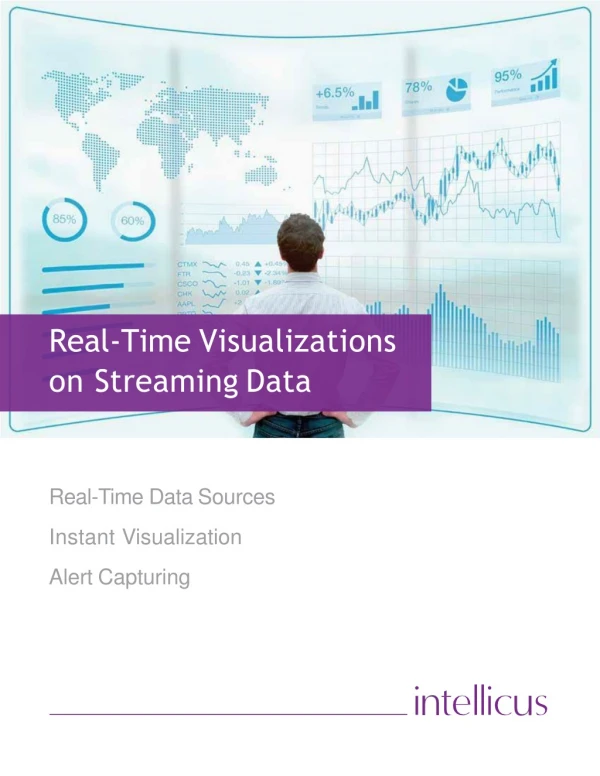
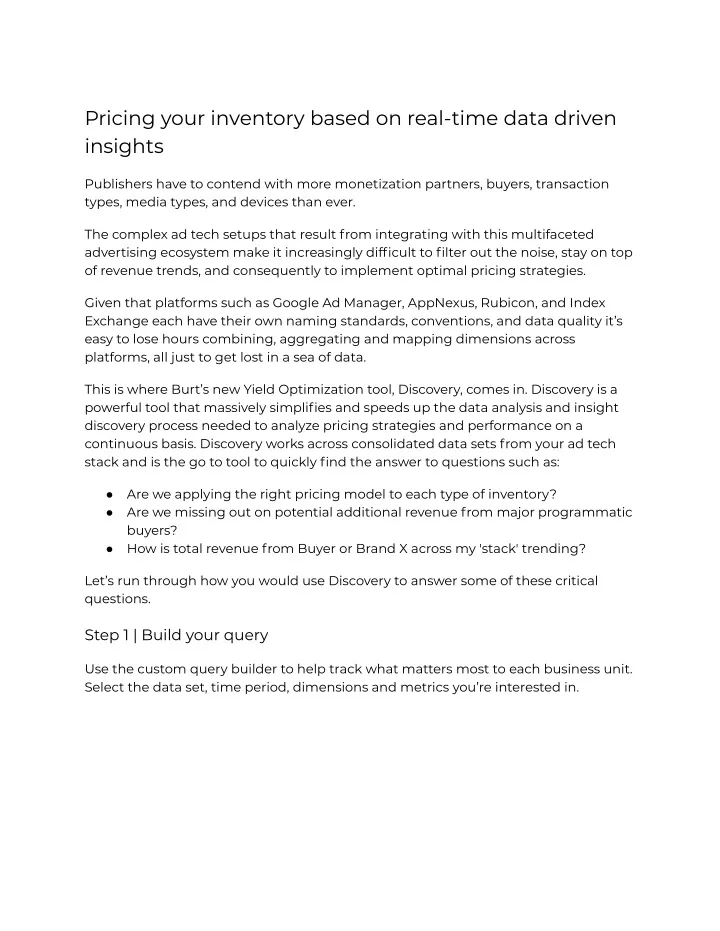
Pricing your inventory based on real-time data driven insights Publishers have to contend with more monetization partners, buyers, transaction types, media types, and devices than ever. The complex ad tech setups that result from integrating with this multifaceted advertising ecosystem make it increasingly difficult to filter out the noise, stay on top of revenue trends, and consequently to implement optimal pricing strategies. Given that platforms such as Google Ad Manager, AppNexus, Rubicon, and Index Exchange each have their own naming standards, conventions, and data quality it’s easy to lose hours combining, aggregating and mapping dimensions across platforms, all just to get lost in a sea of data. This is where Burt’s new Yield Optimization tool, Discovery, comes in. Discovery is a powerful tool that massively simplifies and speeds up the data analysis and insight discovery process needed to analyze pricing strategies and performance on a continuous basis. Discovery works across consolidated data sets from your ad tech stack and is the go to tool to quickly find the answer to questions such as: Are we applying the right pricing model to each type of inventory? Are we missing out on potential additional revenue from major programmatic buyers? How is total revenue from Buyer or Brand X across my 'stack' trending? ● ● ● Let’s run through how you would use Discovery to answer some of these critical questions. Step 1 | Build your query Use the custom query builder to help track what matters most to each business unit. Select the data set, time period, dimensions and metrics you’re interested in.
Step 2 | Identify outliers Discovery displays the data in heat-maps, allowing you to easily identify outliers in your data that merit further investigation. Activate the comparison feature to easily reveal any units or partners performing better or worse than the previous period.
Step 3 | Do a deep-dive into the data Now here’s where things get really interesting. Depending on what you want to investigate, you can drill down into your data to find the root cause of any issues you have identified or to finds ways to capitalize on positive trends. These insights are difficult to uncover through traditional means since they necessitate an agile approach to analytics, requiring you to test and probe different hypotheses. It is precisely this type of dynamic analytics which Discovery excels at. Example | Applying the correct pricing model to the right inventory Publishers are able to use Discovery to isolate pockets of inventory based on performance. This allows them to match inventory to the ideal advertiser. For example, we can identify slices of inventory with low CPC which would be good for performance-oriented campaigns.
On the other hand, inventory with high viewability and high CPC can be ideal for branding campaigns. Note the two different floor price strategies for viewability vs clicks: If an advertiser is interested in viewable inventory, they’re going to buy heavily on inventory with low vCPM. By isolating inventory where you think advertisers are buying for viewability / branding effects, there may be an opportunity to raise the floor price and increase revenue. Alternatively, for inventory where you think advertisers are buying for cheap clicks and place less importance on viewability, you may lose business if you raise floor prices too much. ● ● Example | Investigating a low fill rate In the below example we see that the fill rate on desktop is significantly higher than on smartphone. Since we also see in this example that the most impressions are delivered on smartphone it merits investigating what is behind the lower fill rate. Identifying the cause may allow us to adjust our strategy and minimize the impact. As a first step in looking for an answer, we can look at this metric over time to see if it’s a recent occurrence.
As this isn’t a new issue we need to dig further. From a first drill down, we see that the smartphone fill rate is lower than desktop across all sites. Since the issue is not isolated to one site the answer must lie elsewhere. A clue might lie in the fact that the low fill rate on smartphone is isolated to certain advertisers.
Drilling down into the data further still, this time at the level of an advertiser, shows it is the 300 x 250 creative size that stands out as being where the issues is. Going to another level of granularity we see that certain creatives perform much worse at the level of fill rate than others. This tells us that the answer likely lies in looking at what is different about those creatives.
Capture the maximum value of every impression Sales, ad ops, and revenue teams alike can get value from using Discovery to reveal insights and opportunities hidden in your data. Having visibility across your entire inventory with the ability to leverage real-time data is critical to your capacity to react to changing market dynamics effectively. If you’re a Burt customer not yet subscribed to Discovery let your Account Manager know and they’ll be happy to give you a tour. Alternatively, you can book a demo by completing the below form.