Download
1 / 61

E N D
ENVIRONMENTAL ENGINEERING – IU19CET54 • Course Objectives • This course should enable the students to • Understand the basics, importance, and methods of water supply. • Gain knowledge on various sources and properties of water. • Understand the various methods of conveyance of water. • Learn the objectives and methods of water treatment and to study the features and function of different water treatment units. • Learn the importance of rain water harvesting and water pollution.
UNIT I INTRODUCTION TO WATER SUPPLY (9 Hrs) • Environmental Engineering - Role of Environmental Engineer - Water supply - development of public water supply - need for protected water supplies - objectives of water supply systems - water supply scheme-quantity of water - estimating requirements - Design period – per capita consumption - fluctuations in demand pattern -population forecast – Arithmetic, Incremental, Geometric methods
Environment • Environment means all of the outside forces, events and things that act on a thing. • A person's environment is made up of everything that surrounds him or her, including houses, buildings, people, animals, land, temperature, water, light, and other living and non-living things. • Living things do not simply exist in their environment. They constantly interact with it. Organisms change in response to conditions in their environment. The environment consists of the interactions among plants, animals, soil, water, temperature, light, and other living and non-living things.
Environmental Engineering • Environmental engineering is the integration of science and engineering principles to improve the natural environment (air, water, and/or land resources), to provide healthy water, air, and land for human habitation (house or home) and for other organisms, and to remediate pollution sites. • Further more it is concerned with finding plausible solutions in the field of public health, such arthropod-borne diseases, implementing law which promote adequate sanitation in urban, rural and recreational areas. • It involves waste water management and air pollution control, recycling, waste disposal, radiation protection, industrial hygiene, environmental sustainability, and public health issues as well as a knowledge of environmental engineering law. It also includes studies on the environmental impact of proposed construction projects.
Environmental Engineer • Environmental engineers study the effect of technological advances on the environment. • To do so, they conduct hazardous-waste management studies to evaluate the significance of such hazards, advise on treatment and containment, and develop regulations to prevent mishaps. • Environmental engineers also design municipal water supply and industrial wastewater treatment systems as well as address local and worldwide environmental issues such as the effects of acid rain, global warming, ozone depletion, water pollution and air pollution from automobile exhausts and industrial sources.
At many universities, Environmental Engineering programs follow either the Department of Civil Engineering or The Department of Chemical Engineering at Engineering faculties. Environmental "civil" engineers focus on hydrology, water resources management, bioremediation, and water treatment plant design. Environmental "chemical" engineers, on the other hand, focus on environmental chemistry, advanced air and water treatment technologies and separation processes. • Additionally, engineers are more frequently obtaining specialized training in law and are utilizing their technical expertise in the practices of Environmental engineering law.About four percent of environmental engineers go on to obtain Board Certification in their specialty area(s) of environmental engineering.
Water • Water is a chemical compound with the chemical formula H2O. A water molecule contains one oxygen and two hydrogen atoms connected by covalent bonds. Water is a liquid at standard ambient temperature and pressure, but it often co-exists on Earth with its solid state, ice, and gaseous state (water vapor or steam). Water also exists in a liquid crystal state near hydrophilic surfaces. • Water covers 71% of the Earth's surface, and is vital for all known forms of life. On Earth, 96.5% of the planet's water is found in oceans, 1.7% in groundwater, 1.7% in glaciers and the ice caps of Antarctica and Greenland, a small fraction in other large water bodies, and 0.001% in the air as vapor, clouds (formed of solid and liquid water particles suspended in air), and precipitation.Only 2.5% of the Earth's water is freshwater, and 98.8% of that water is in ice and groundwater. Less than 0.3% of all freshwater is in rivers, lakes, and the atmosphere, and an even smaller amount of the Earth's freshwater (0.003%) is contained within biological bodies and manufactured products.
Water on Earth moves continually through the water cycle of evaporation and transpiration (evapotranspiration), condensation, precipitation, and runoff, usually reaching the sea. Evaporation and transpiration contribute to the precipitation over land. • Safe drinking water is essential to humans and other life forms even though it provides no calories or organic nutrients. Access to safe drinking water has improved over the last decades in almost every part of the world, but approximately one billion people still lack access to safe water and over 2.5 billion lack access to adequate sanitation. There is a clear correlation between access to safe water and GDP per capita. However, some observers have estimated that by 2025 more than half of the world population will be facing water-based vulnerability. • A recent report (November 2009) suggests that by 2030, in some developing regions of the world, water demand will exceed supply by 50%. Water plays an important role in the world economy, as it functions as a solvent for a wide variety of chemical substances and facilitates industrial cooling and transportation. Approximately 70% of the fresh water used by humans goes to agriculture.
IMPORTANCE AND NECESSITY FOR PLANNED WATER SUPPLIES • Next to the air, the other important requirement for human life to exists is water. Water is available in various forms such as rivers, lake, streams etc. The earliest civilizations organized on the banks of major river systems and required water for drinking, bathing, cooking etc. • But with the advancement of civilization the utility of water enormously increased and now such a stage has come that without well organized public water supply scheme, it is impossible to run the present civic life and the develop the towns. The importance of water from only a quantity viewpoint was recognized from the earliest days and the importance of quality come to be recognized gradually in the later days. • The earliest recorded knowledge of water quality and its treatment are found in Sanskrit literature “SushuriSanhita” compiled about 2000 B.C. It deals with storage of drinking water in copper vessels, exposure to sunlight, filtering through charcoal, sand etc.
The correlation between water quality and incidence of diseases was first established in 1849 by Dr. John snow when cholera appeared in London during the summer and 14,600 deaths were reported. But Dr. snow unable to convince the authorities and public with the evidence of available data. • The water borne diseases like typhoid, dysentery, cholera etc the concept of water borne diseases was well accepted by 1900. • Another striking example was reported from Uttarpradesh by W.H.O (World Health Organization) in 1963, there the death rate by cholera decreased by 74.1%, Typhoid fever by 63.6% , by dysentery 23.1% and diarria by 63.6%. All these were achieved by drinking water treatment.
NEED FOR PROTECTED WATER SUPPLY • Protected water supply means the supply of water that is treated to remove the impurities and made safe to public health. Water may be polluted by physical and bacterial agents. Water is also good carrier of disease causing germs. The causes of outbreak of epidemics are traced to pollute water and poor sanitation hospital are continued to be flooded with the sick due to ignorance about health continues to be profound. • However during the last few decades, improvements in the public health protection by supplying safe water and sanitation to all the people in the developing countries. In 1977, united nations declare to launch a movement known as “HEALTH FOR ALL BY THE YEAR 2000 A.D.” India is also a signatory to that conference. The working group appointed by the planning commission while suggesting strategies for achieving the above goal emphasized that potable water from protected water supply should be made available to the entire population. Pure and whole some water is to be supplied to the community alone can bring down the morbidity rates.
The objectives of the community water supply system are • to provide whole some water to the consumers for drinking purpose. • to supply adequate quantity to meet at least the minimum needs of the individuals. • to make adequate provisions for emergencies like fire fighting, festivals, meeting etc. • to make provision for future demands due to increase in population, increase in standard of living, storage and conveyance. • to prevent pollution of water at source, storage and conveyance. • to maintain the treatment units and distribution system in good condition with adequate staff and materials. • to design and maintain the system that is economical and reliable.
WHOLE SOME WATER • Absolutely pure water is never found in nature and which contains only two parts of hydrogen and one part of oxygen by volume. But the water found in nature contains number of impurities in varying amounts. The rainwater which is originally pure, also absorbs various gases, dust and other impurities while filling. This water when moves on the ground further carries silt, organic and inorganic impurities. • The removal of the turbidity, odour and smell is considered as good and removal of dissolved substances is considered as “chemically pure”. But removal of substances like calcium, magnesium Iron, Zinc etc completely is not good for health. These minerals are required for tissue growth and some act as prophylactic in preventing diseases. • Therefore wholesome water is defined as the water which containing the minerals in small quantities at requisite levels and free from harmful impurities Chemically pure water is also corrosive but not whole some water. The water that is fit for drinking safe and agreeable is called potable water.
The following are the requirements of wholesome water • It should be free from bacteria • It should be colourless and sparkling • It should be tasty, odour free and cool • It should be free from objectionable matter • It should not corrode pipes • It should have dissolved oxygen and free from carbonic acid so that it may remain fresh
STATUS OF PROTECTED WATER SUPPLY IN INDIA • Lack of safe drinking water in India is still a problem in many areas of the country. As per the U.N. report (1983), town and cities only 86% of the urban population have some provision for protected water supplies. • Only one village out of ten has safe drinking water. It is important to note that 80% of India’s population live in villages and only 6 crores have access for safe water.
PLANNING AND EXECUTION OF MODERN WATER SUPPLY SCHEMES • After British rule in our country, investments made in successive five year plans for planned development towards urban and Rural water supply and sanitation. Because of shortage of funds and some other reasons were responsible for slow growth of water supply facilities during the last five year plans. • There are many central, state and International agencies coordinating and executing the urban and rural water supply schemes in the country
Central Public Health and Environment organization under the ministry of works and housing formulates schemes and provide assistance to states planning and development. • National Environment Engineering Research Institute (NEERI) is a research institute of Govt. of India, conducts water quality surveys and suggests treatment processes and also provides design of treatment and distribution system • CSIR laborites (Council of Scientific and Industrial Research) provide testing facilities for water quality maintenance. • Central ground water bound, Geological survey of India, National Geographical Research Institute (NGRI) are engaged afflicted by fluoride Iron, Manganese etc. • Technology missions were launched by Govt. of India in 1986 with submissions on control of flows • Bharat Heavy Electricals Limited is providing technology in such special processes like Reverse Electro-Dialysis. • Public Health Engineering Departments undertake execution of large schemes for water supply and sanitation.
State ground water department evaluates the quality and quantity of ground water all over the state. • Panchayat Raj Engineering department of state Govt. is the model agency for providing water supply and sanitation facilities in rural and urban panchayats. • A.P. State council of science and technology is engaged in assessing the status and quality of drinking water availability and requirements in selected areas. • Medium and major irrigation departments of Govt. undertake multipurpose schemes in the state with component of water supply along with Hydroelectric, irrigation, navigation, tourism and other services. • Educational institutions – many engineering colleges offer course in environmental engineering water supply and sanitary engineering at degree and postgraduate levels. Polytechnics and vocational courses conduct courses in water supply engineering to train the technicians and engineers to the growing demand • International organizations like UNICEF (United Nations Health Organization) provide technical assistance and knowledge on water supply schemes working in specific problem areas. • There are many Non-Governmental organizations (N.G.O) like water development society, Environmental Protection Societies operating in limited areas with donations and contributions by public and Govt.
WATER DEMANDS VARIOUS TYPES OF WATER DEMANDS • While designing the water supply scheme for a town or city, it is necessary to determine the total quantity of a water required for various purposes by the city. As a matter of fact the first duty of the engineer is to determine the water demand of the town and then to find suitable water sources from where the demand can be met. But as there are so many factors involved in demand of water, it is not possible to accurately determine the actual demand. Certain empirical formulae and thumb rules are employed in determining the water demand, which is very near to the actual demand. Following are the various types of water demands of a city or town: • Domestic water demand • Industrial demand • Institution and commercial demand • Demand for public use • Fire demand • Loses and wastes
DOMESTIC WATER DEMAND • The quantity of water required in the houses for drinking, bathing, cooking, washing etc is called domestic water demand and mainly depends upon the habits, social status, climatic conditions and customs of the people. As per IS: 1172-1963, under normal conditions, the domestic consumption of water in India is about 135 liters/day/capita. But in developed countries this figure may be 350 liters/day/capita because of use of air coolers, air conditioners, maintenance of lawns, automatic household appliances. Min. Domestic Water Consumption (Annual Average) for Indian Towns and Cities with full flushing systems as per IS 1172 - 1993.
Minimum Domestic Water Consumption (annual Average) for Weaker Section and LIG Colonies in small Indian Towns and Cities
INDUSTRIAL DEMAND • The water required in the industries mainly depends on the type of industries, which are existing in the city. The water required by factories, paper mills, Cloth mills, Cotton mills, Breweries, Sugar refineries etc. comes under industrial use. The quantity of water demand for industrial purpose is around 20 to 25% of the total demand of the city.
INSTITUTION AND COMMERCIAL DEMAND • Universities, Institution, commercial buildings and commercial centers including office buildings, warehouses, stores, hotels, shopping centers, health centers, schools, temple, cinema houses, railway and bus stations etc comes under this category. As per IS: 1172-1963, water supply requirements for the public buildings other than residences as follows.
DEMAND FOR PUBLIC USE • Quantity of water required for public utility purposes such as for washing and sprinkling on roads, cleaning of sewers, watering of public parks, gardens, public fountains etc comes under public demand. To meet the water demand for public use, provision of 5% of the total consumption is made designing the water works for a city. • Sl.No. Purpose Water Requirements 1. Public parks 1.4 litres/m 2/day 2. Street washing 1.0-1.5 litres/m 2/day 3. Sewer cleaning 4.5 litres/head/day
FIRE DEMAND • Fire may take place due to faulty electric wires by short circuiting, fire catching materials, explosions, bad intension of criminal people or any other unforeseen mishappenings. If fires are not properly controlled and extinguished in minimum possible time, they lead to serious damage and may burn cities. • All the big cities have full fire-fighting squads. As during the fire breakdown large quantity of water is required for throwing it over the fire to extinguish it, therefore provision is made in the water work to supply sufficient quantity of water or keep as reserve in the water mains for this purpose. In the cities fire hydrants are provided on the water mains at 100 to 150 m apart for fire demand.
The quantity of water required for fire fighting is generally calculated by using different empirical formulae. For Indian conditions kuichingsformula gives satisfactory results. • Q=3182√ p Where ‘Q’ is quantity of water required in litres/min ‘P’ is population of town or city in thousands
LOSSES AND WASTES • All the water, which goes in the distribution, pipes does not reach the consumers. The following are the reasons • Losses due to defective pipe joints, cracked and broken pipes, faulty valves and fittings. • Losses due to, consumers keep open their taps of public taps even when they are not using the water and allow the continuous wastage of water • Losses due to unauthorized and illegal connections • While estimating the total quantity of water of a town; allowance of 15% of total quantity of water is made to compensate for losses, thefts and wastage of water
PER CAPITA DEMAND • If ‘Q’ is the total quantity of water required by various purposes by a town per year and ‘p’ is population of town, then per capita demand will be Q • Per capita demand = ------------------ litres/day P x 365 • Per capita demand of the town depends on various factors like standard of living, no. and type of commercial places in a town etc. For an average Indian town, the requirement of water in various uses is as under
FACTORS AFFECTING PER CAPITA DEMAND The following are the main factors affecting for capita demand of the city or town. Climatic conditions : • The quantity of water required in hotter and dry places is more than cold countries because of the use of air coolers, air conditioners, sprinkling of water in lawns, gardens, courtyards, washing of rooms, more washing of clothes and bathing etc. But in very cold countries sometimes the quantity of water required may be more due to wastage, because at such places the people often keep their taps open and water continuously flows for fear of freezing of water in the taps and use of hot water for keeping the rooms warm. Size of community : • Water demand is more with increase of size of town because more water is required in street washing, running of sewers, maintenance of parks and gardens.
Living standard of the people : • The per capita demand of the town increases with the standard of living of the people because of the use of air conditioners, room coolers, maintenance of lawns, use of flush, latrines and automatic home appliances etc. Industrial and commercial activities : • As the quantity of water required in certain industries is much more than domestic demand, their presence in the town will enormously increase per capita demand of the town. As a matter of the fact the water required by the industries has no direct link with the population of the town.
Pressure in the distribution system: • The rate of water consumption increase in the pressure of the building and even with the required pressure at the farthest point, the consumption of water will automatically increase. This increase in the quantity is firstly due to use of water freely by the people as compared when they get it scarcely and more water loss due to leakage, wastage and thefts etc. System of sanitation: • Per capita demand of the towns having water carriage system will be more than the town where this system is not being used. Cost of water: • The cost of water directly affects its demand. If the cost of water is more, less quantity of water will be used by the people as compared when the cost is low.
VARIATIONS IN DEMAND • The per capita demand of town is the average consumption of water for a year. In practice it has been seen that this demand does not remain uniform throughout the year but it various from season to season, even hour to hour. SEASONAL VARIATIONS • The water demand varies from season to season. In summer the water demand is maximum, because the people will use more water in bathing, cooling, lawn watering and street sprinkling. This demand will becomes minimum in winter because less water will be used in bathing and there will be no lawn watering. The variations may be upto 15% of the average demand of the year.
DAILY VARIATIONS • This variation depends on the general habits of people, climatic conditions and character of city as industrial, commercial or residential. More water demand will be on Sundays and holidays due to more comfortable bathing, washing etc as compared to other working days. The maximum daily consumption is usually taken as 180% of the average consumption. HOURLY VARIATIONS • On Sundays and other holidays the peak hours may be about 8 A.M. due to late awakening where as it may be 6 A.M. to 10 A.M. and 4 P.M. to 8 P.M. and minimum flow may be between 12P.M. to 4P.M. when most of the people are sleeping. But in highly industrial city where both day and night shifts are working, the consumption in night may be more. The maximum consumption may be rise upto 200% that of average daily demand. The determination of this hourly variations is most necessary, because on its basis the rate of pumping will be adjusted to meet up the demand in all hours.
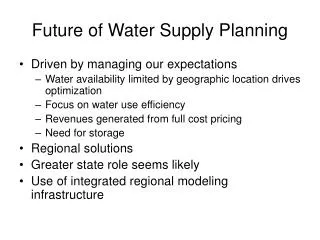
DESIGN PERIOD • The complete water supply project includes huge and costly constructions such as dams, reservoirs, treatment works and network of distribution pipelines. These all works cannot be replaced easily or capacities increased conveniently for future expansions. While designing and constructing these works, they should have sufficient capacity to meet future demand of the town for number of years. The number of years for which the designs of the water works have been done is known as design period. Mostly water works are designed for design period of 22-30 years, which is fairly good period. TOTAL REQUIREMENT OF WATER FOR A TOWN OR A CITY • Total quantity of water required by a town or a city per day shall be 270 multiplied with the total population in liters/day.
POPULATION FORECASTING METHODS AND PROBLEMS • When the design period is fixed the next step is to determine the population of a town or city population of a town depends upon the factors like births, deaths, migration and annexation. • The future development of the town mostly depends upon trade expansion, development industries, and surrounding country, discoveries of mines, construction of railway stations etc may produce sharp rises, slow growth, stationary conditions or even decrease the population. • For the prediction of population, it is better to study the development of other similar towns, which have developed under the same circumstances, because the development of the predicted town will be more or less on the same lines.
The following methods are generally used for predicting population: • Annual rate of increase method • Arithmetical progression method • Geometrical progression method • Incremental increase method • Changing rate of increase method • Graphical method • Graphical method based on single city • Graphical method based on cities with similar growth pattern • Demographic method of population projection • Decreasing rate of growth method • Logistic method • Method of density
Annual rate of increase method In this method, the rate of increase per annum is first determined and the population predicted there from. Pn= Population at the end of n years P=Population at any time i= annual rate of increase of population
Arithmetical progression method In this method, a constant increase in the growth of population is added periodically. The population may be determined at the end of n years or n decades. P – Present population i – per year or decade increase of population The method is good for old cities or small towns which have stabilized. Its use is limited as it gives rather low results.
Geometrical progression method In this method, a constant percentage growth is assumed for equal periods of time. Thus, the population at the end of n years or decades is given as i – per year or decade percentage rate of increase. This method should be used carefully as it may give erroneously high results when applied to young and rapidly advancing cities having expansion of short duration only.
Incrementalincrease method In this method, the average of increase in population is found out as per arithmetical progression method and to that is added the average of the net incremental increase once for every future decade. Evidently, this method embodies the advantages of both the preceding methods and the value of population obtained is therefore more correct.
Changing rate of increase method This is similar to the geometrical progression method except that a changing rather than a constant rate of increase is assumed. The changing rate for large and grown up cities is usually considered to be a decreasing rate. This method gives quite rational results.
Graphical method • In this approach there are two methods. In one, only the city in question is considered and in the second, other similar cities are also taken into account. • Graphical method based on single city In this method the population curve of the city (i.e. the population vs past decades) is smoothly extended for getting future value. This extension has to be done carefully and it requires vast experience and good judgment. The line of best fit may be obtained by the method of least squares. • Graphical method based on cities with similar growth pattern in this method the city in question is compared with other cities which have already undergone the same phases of development which the city in question is likely to undergo and based on this comparison, a graph between population and decades is plotted.
Demographic method of population projection population change can occur only in three ways • by birth (population gain) • by death (population loss) • migration (population loss or gain depending on whether movement out or movement in occurs in excess). Annexation of an area may be considered as a special form of migration. Population forecasts are frequently obtained by preparing and summing up of separate but related projections of natural increases and net migration and expressed as below.
The net effect of birth and deaths on population is termed natural increase. Migration also affects the number of births and deaths in an area and so, projections of net migration are prepared before projections for natural increase. • This method thus takes into account the prevailing and anticipated birth rates and death rates of the region or city for the period under consideration. • An estimate is also made of the emigration from and immigration to the city, growth of city area wise, and the net increase of population is calculated accordingly considering all these factors, by arithmetical balancing.