Download
1 / 14
140 likes | 148 Views
Basic ,core,curriculum, education, teaching, guide, levels,source, description, types

E N D
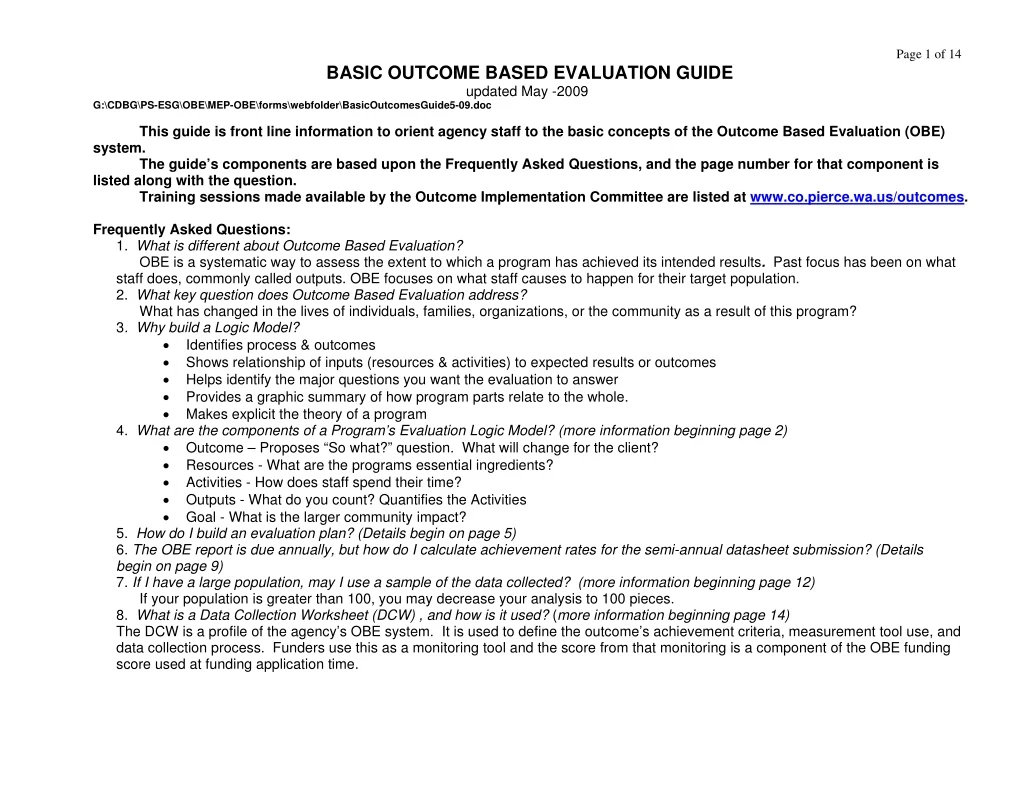
Page 1 of 14 BASIC OUTCOME BASED EVALUATION GUIDE updated May -2009 G:\CDBG\PS-ESG\OBE\MEP-OBE\forms\webfolder\BasicOutcomesGuide5-09.doc This guide is front line information to orient agency staff to the basic concepts of the Outcome Based Evaluation (OBE) system. The guide’s components are based upon the Frequently Asked Questions, and the page number for that component is listed along with the question. Training sessions made available by the Outcome Implementation Committee are listed at www.co.pierce.wa.us/outcomes. Frequently Asked Questions: 1. What is different about Outcome Based Evaluation? OBE is a systematic way to assess the extent to which a program has achieved its intended results. Past focus has been on what staff does, commonly called outputs. OBE focuses on what staff causes to happen for their target population. 2. What key question does Outcome Based Evaluation address? What has changed in the lives of individuals, families, organizations, or the community as a result of this program? 3. Why build a Logic Model? • Identifies process & outcomes • Shows relationship of inputs (resources & activities) to expected results or outcomes • Helps identify the major questions you want the evaluation to answer • Provides a graphic summary of how program parts relate to the whole. • Makes explicit the theory of a program 4. What are the components of a Program’s Evaluation Logic Model? (more information beginning page 2) • Outcome – Proposes “So what?” question. What will change for the client? • Resources - What are the programs essential ingredients? • Activities - How does staff spend their time? • Outputs - What do you count? Quantifies the Activities • Goal - What is the larger community impact? 5. How do I build an evaluation plan? (Details begin on page 5) 6. The OBE report is due annually, but how do I calculate achievement rates for the semi-annual datasheet submission? (Details begin on page 9) 7. If I have a large population, may I use a sample of the data collected? (more information beginning page 12) If your population is greater than 100, you may decrease your analysis to 100 pieces. 8. What is a Data Collection Worksheet (DCW) , and how is it used? (more information beginning page 14) The DCW is a profile of the agency’s OBE system. It is used to define the outcome’s achievement criteria, measurement tool use, and data collection process. Funders use this as a monitoring tool and the score from that monitoring is a component of the OBE funding score used at funding application time.
Page 2 of 14 DEVELOPING A PROGRAM EVALUATION LOGIC MODEL PROCESS Components: 1. Resources - What must this program have in order to function well? Examples: • Staff- Admin and program • Setting, facilities • Collaborations, community partners • Funding, stakeholders • Service Technology • Participants 2. Activities - What service does your staff and/or volunteers provide? Examples: • Provide medical treatment • Provide training in conflict resolution • Provide meals 3. Outputs – Outputs quantify the activities listed in Logic Model. How much of a service is possible. Examples: • 25 people/month receive medical treatment • 2000 meals/year provided 4. Outcomes – Select your primary outcome and its indicators from the Mandatory Outcome List (available on the web or from funder) that bests represents your program’s core service from the appropriate service strategy categories. Then choose a second outcome and its indicators that also reflect basic service from the Outcomes Catalogue (available on the web or from funder). • Service Strategies are: Children, Youth & Families: Children 0-8 and Youth 9+; Community Mobilization; Employment & Education; Health & Mental Health; Intimate Violence; Seniors & Disabled; Stability: Emergency Services and Housing/Case Management. Be sure to choose the outcome stage that you intend to measure. • Those stages are: Customer Service; Temporary Change in Condition; Knowledge: Attitude; Skill; Behavior; Status; Community; and, System. How Do You Identify Outcomes? Note: Is it a Change Statement, or does it need to be a Target or Benchmark? For example a specific levels of achievement, such as a 90 % attendance rate. • Youth Development (9+ years); Family Focused; Community Mobilization; Employment & Education ; Health & Mental Health; Intimate Violence; Seniors & Disabled; Stability: Emergency Services or Housing Services/Case Management • What would you like to be different for the population your program serves?
Page 3 of 14 • • • Which of these are short-term and can be achieved in less than one year? Which take longer to occur? What are the steps the participants must take to grow and develop? Does an individual stability plan need to be in place , and can you chart the achievement steps or goals of the plan in a measurable way? What part of this change can your program directly influence or cause to happen? • Indicators – How can Indicators Make Outcomes Measurable? Identify the logical link between the outcome stage and a corresponding indicator, for example: an outcome that changes knowledge should have an indicator that demonstrates knowledge. Indicators should be a direct measure of the outcome. Good indicators are measurable—they can be seen, heard or read, they are specific—conveying one concept. Select indicators that will assist you in understanding the program and where program improvements might be necessary. The measurement tool must clearly state the indicator, so a measurable response is acquired. 5. Goal - Select a goal for your program that reflects the impact services has to the larger community. You may need the other community partners to help achieve this goal.
Page 4 of 14 LOGIC MODEL Program Outcome Based Evaluation The Pierce County Funders Group requires a primary outcome from the Mandatory Outcome List and an additional outcome from the Outcome Catalogue along with 2 indicators each. Program Evaluation Logic Model Year Covered: Agency ____________________________________ Program ____________________________________________ Date ________________________________ Person Completing the Model _________________________________ Resources Activities Outputs Outcomes Goals DESCRIPTION OF THE EVALUATION PLAN TAKEN FROM COMMON APPLICATION Agency __________________________ Program _____________________________Date prepared______________
Page 5 of 14 BUILDING AN EVALUATION PLAN Components: Outcomes and Indicators: From the Logic Model, list the two outcomes (one from the Mandatory List and the other from the Outcome Catalogue) for your program that show the core changes your program makes in your clients and corresponding Indicators. Measurement Tools/Approach: Must be developed to represent each indicator of each outcome. Choose from what perspective (Client or Staff) as appropriate for the population. Client perspective: • Assessment Surveys - written instruments containing several questions about issues to be evaluated. • Interviews - a series of questions conducted in person or over the telephone. The advantage is the ability to clarify ambiguous responses. • Focus Groups - a series of questions conducted in a group setting, where all participants’ comments are documented. Validity of focus groups is maintained by having an experienced Focus Group Facilitator. Staff or Program perspective: • Observations - First hand observation of interactions and events witnessed and documented by a staff member or volunteer. • Case Records - Review of the clients case record or family plan. • Official Records - Review of existing information collected by agencies or institutions. Sampling Strategy and Sample Size are additional decisions for measuring outcomes. • Sampling is a systematic method to gather data from a subset of the population receiving services. • Sampling is only permissible, if more than 100 clients will be served during the program duration. The number of clients in a sample is dependent upon the 95% confidence interval. (chart is in your packet) • Strategies of sampling: 1. Simple Random Sample - Each member of the population has an equal chance of being selected into the sample. 2. Stratified Sample - Separate the population into groups of similar individuals and then using a Simple Random Sample of each group. 3. Systematic Sample - Assign a number to each person in the population and select people at equal intervals from a random starting place. 4. Convenience Sample - Participants are selected based upon their availability. (Not recommended unless there are no other options)
Page 6 of 14 Implementing the Measurement Tool is decided upon by a Frequency and Schedule of Data Collection strategy: • Slice in Time - the clients that you see in any given month are a “representative sample” of the population throughout the year. • Specific Client Tracking - collects data on each client throughout the time period they are utilizing services. Ask the question, “How often will data be collected?” Specifics: • submitted monthly by case managers • upon exit from program submitted to Program Manager • every 6 weeks after intake Validity and Reliability of Measurement Tool (A table of choices is in the appendix) Validity is the degree of accuracy you can expect from a data collection tool. The test: is X really X? Example: Does a resume on file - mean that the client has attained resume writing skills? Yes - if the client developed the resume, thus acquiring a skill. No - if the staff developed the resume. Reliability is the degree of consistency a particular data collection tool provides. Clarifying question: If Jane and Joe both complete the same observation tool on Jim’s achievements, will they reach the same conclusion or score?
Page 7 of 14 OBE requires a number of decisions. It is useful to outline the process you will use for each outcome. After listing the outcomes and their indicators, list specifically for each of the outcomes to be measured, what the process for data collection will entail: •Measurement Tool/Approach – For example: participant interviews, focus groups, written surveys, case manager or staff assessment of participants, information collected from government, school, business or agency records. •Sampling Strategy and Sample Size – For example: mailing a survey to a random sample of ten percent of participants; interviewing every third participant; having focus groups that are representative of participants based on race and gender; monitoring school activities and grades of each participant; monitoring for evidence of substance abuse among 10th grade students at high school X; etc. •Frequency and Schedule of Data Collection – For example: collect pre-test data before a program starts and a post-test after one year, or collect data every six months starting with the first contact with participants. Outcomes and Indicators Measurement Tool/Approach Sampling Strategy And Sample Size * O I I O I I * Note: If less than 100 participants are served, Agency must attempt to collect data from all participants. This OBE process outline is further developed through the Data Collection Worksheet which is included in this Guide. Frequency And Schedule Of Data Collection
Page 8 of 14 ESTABLISH VALIDITY AND RELIABILITY OF MEASUREMENT TOOLS TAKEN FROM COMMON APPLICATION Agency __________________________ Program _____________________________Date prepared______________ Assessment of validity and reliability helps determine the amount of faith people should place in the results. Taking steps to assure validity and reliability helps build credibility for your evaluation. VALIDITY – Assuring that your data accurately measures what you intend to measure. (Is “x” really “x”?) RELIABILITY – Assuring that your data is consistent over time and under various conditions. (Will “x” remain “x”?) Below is a list of options. Not all of these will apply to your evaluation design and you are not obligated to use them all. However, for those that do apply, using more than one will add greater assurance to the credibility of your data. Please check those that apply. VALIDITY Use established survey tools Hold focus groups or interview participants to get feedback on what they feel is important Pilot test your questions to be sure the questions you are asking are measuring what you want Use standard outcomes and measurements defined by professional associations or other research efforts to create your surveys Determine if results from particular measurement items are consistent with other known findings Other (please describe) Establish a measurement approach/tool that works for the specific population with whom it will be used Other (please describe) RELIABILITY Train the individuals implementing the evaluation plan Provide regular supervision of staff implementing the plan Assign one or two people to do data entry Create scoring instructions on how to code the data collected Create instructions on how to interpret the answers to open- ended questions Check inter-coder reliability. Have two different people score the data and compare the percentage of answers that they agreed upon. Achieve a 90% or higher agreement rate. Other (please describe) Create specific definitions of levels of progress or achievement for participants for staff to use in their evaluations Conduct a quality check of data entry Other (please describe)
Page 9 of 14 Semi-AnnualDatasheet Preparation The semi-annual datasheets are designed to be a place for you to present the data collected during the reporting period and calculate the achievement percentages of Outcomes and Indicators. This attachment will help you complete these sections. NOTE: Eighteen months of historical data is used for analysis purposes in the annual report. Calculating Outcome Achievement In order to calculate the outcome achievement percentages, you must select an achievement criteria (this is how you define success or “achievement” of the outcome). This criteria outlines what indicators must be achieved in order to achieve the larger outcome. There are five options to choose from: Indicator A only, Indicator B only, Indicator A or B, Indicator A and B, or Other (i.e. Must meet Indicator A and 50% of Indicator B). The criteria you select for each outcome typically does not change and acts as a foundation for determining which clients are successful in achieving the outcome. Once you have selected the achievement criteria for each outcome, you can calculate the number and percentage of clients who achieved. Depending on the criteria you select the process for calculating this information is different. The process for each of the major four criteria is listed below. Keep in mind that “N” equals the total number of program participants (if you are not sampling) and “n” equals the number of consumers represented in your sample (use only if you sample). Indicator A Only: 1. Determine the clients who achieved Indicator A (refer to the instructions on Calculating Indicator Achievement) 2. Sum all program participants who achieved Indicator A. Because clients only need to achieve Indicator A only, this is the number of clients who achieved the outcome. 3. Calculate the percentage of clients who achieved the outcome by: • If you are not sampling, divide the number of clients meeting Indicator A (A) by the total number of people served (N). The math equation is A/N. • If you are sampling, divide the number of clients meeting Indicator A by the total number of people in sample (n). The math equation is A/n. Indicator B Only: 1. Determine the clients who achieved Indicator B (refer to the instructions on Calculating Indicator Achievement) 2. Sum all program participants who achieved Indicator B. Because clients only need to achieve Indicator B only, this is the number of clients who achieved the outcome. 3. Calculate the percentage of clients who achieved the outcome by: • If you are not sampling, divide the number of clients meeting Indicator B (B) by the total number of people served (N). The math equation is B/N. • If you are sampling, divide the number of clients meeting Indicator B by the total number of people in sample (n). The math equation is B/n.
Page 10 of 14 Indicator A or B: 1. Determine the clients who achieved Indicator A only and put those clients in one “achievement pile” (refer to the instructions on Calculating Indicator Achievement). 2. Go through the remaining clients and determine who achieved Indicator B, but did not achieve Indicator A. Add those clients to the “achievement pile” of clients who achieved Indicator A only. 3. Sum the clients in the “achievement pile”. 4. This will give you the total number of people who achieved Indicator A or B. Keep in mind that the total number of people achieving should not be greater than the total number of people served (N) or number of people in the sample (n), or less than the number of people achieving each indicator. 5. Calculate the percentage of clients who achieved the outcome by: • If you are not sampling, divide the number of clients meeting Indicator A or B (A or B) by the total number of people served (N). The math equation is A or B/N. • If you are sampling, divide the number of clients meeting Indicator A or B by the total number of people in sample (n). The math equation is A or B/n. Indictor A and B: 1. Calculate the achievement of the Indicators (refer to the instructions on Calculating Indicator Achievement). 2. Using that information, sort the data into four “piles”: • Those who achieved only Indicator A • Those who achieved only Indicator B • Those who achieved neither Indicator A nor B • Those who achieved both Indicator A and B 3. Sum the clients who achieved both Indicator A and B. This is the number of clients who achieved the outcome. Below is a graphic representation. The shaded area represents participants meeting Indicator A and B. 4. Calculate the percentage of clients who achieved the outcome by: • If you are not sampling, divide the number of clients meeting Indicator A and B (A and B) by the total number of people served (N). The math equation is A and B/N.
Page 11 of 14 • If you are sampling, divide the number of clients meeting Indicator A and B by the total number of people in sample (n). The math equation is A and B/n. Calculating Indicator Achievement Like the outcome achievement, you must select an achievement criteria (how you define success) for each indicator in order to calculate the achievement percentages. This criteria outlines what change needs to happen before a client “meets” or “achieves” the indicator, i.e. each client must increase their score on the client assessment test by 10 points. The way you will measure that change is by using your measurement tool. The criteria you select for each indicator typically does not change and acts as a foundation for determining which clients are successful in achieving the indicator. Once you have selected the achievement criteria for each indicator, you must calculate the actual number of clients who achieve and related percentage. Unlike the outcome achievement percentages, the same process is used regardless of the criteria for each indicator. Again, keep in mind that “N” equals the total number of program participants (if you are not sampling) and “n” equals the number of consumers represented in your sample (use only if you sample). Process for calculating achievement 1. Identify the total number of people served during the reporting period 2. If sampling, identify what sampling strategy was used and how many clients were sampled (see below for additional information on sampling) 3. In the Data Analysis section, identify the number of the clients who are in each of the following categories: • Achieved the indicator (using the criteria you select) • Data could not be found or is missing • Haven’t been in the program long enough to evaluate them • Left before you could evaluate them • Did not meet the indicator (using the criteria you select) 4. Total the number of clients in each category. The total should equal the number of people served (N), or if you are sampling the total number of people in the sample (n). 5. Calculate the percentage in each category by: • If you are not sampling, divide the number of clients in that category (X) by the total number of people served (N). The math equation is X/N • If you are sampling, divide the number of clients in that category (X) by the total number of people in sample (n). The math equation is X/n.
Page 12 of 14 SAMPLING STRATEGIES Sampling Not every program can sample. You are eligible to sample only if the program serves at least 100 program participants during the report period. If you sample,your minimum sample size must be at least 100 participants. If you serve fewer than 100 clients and/or cannot get at least 100 points of data, you need to collect data for 100% of program participants. Each program sampling must establish a sampling strategy for how data will be collected. Sampling Strategies The four sampling strategies typically used in Outcome Based Evaluation are: • Random: In a random sample, each client should have an equal chance to be included in the sample. One way to set up a random sampling system is to assign a number to each client and draw numbers at random. This method ensures that every client has the same chance at being selected. • Systematic: Another way to make sure that each client has an equal chance to be selected is to use systematic sampling. In a systematic sample, clients are selected at equal intervals starting at a randomly selected point. For example, you could make an alphabetical list of all clients and pick a number from 1 to 10 from a bag. Use that number (for example 5) to select every 5th client. • Stratified or Representative: Unlike random and systematic, a stratified sample separating out some clients into a smaller group based on similar characteristics (i.e. age) and then randomly selecting within that group. This method allows you to look at a very diverse population and/or look closely at whether or not the characteristic(s) affect the results. • Convenience: In a convenience sample, each client does not have an equal chance of being selected and therefore the results do not statistically reflect the overall population. This method is typically used when the strategies above are not an option, but it is a good way to gather general information. A convenience sample is based on the availability of clients. For example, you select a particular day or public event to gather data. Only the clients present at that time are included in the sample. Sampling Size You must also identify how many people are in your sample (n). This number becomes very important in calculating the percentage of clients achieving the outcomes and indicators. Remember, at least 100 clients need to be in the sample. Sample Spreadsheets Another way to calculate the number of clients achieving the outcome is to use a spreadsheet for a visual aid. This can be done on the computer or put on a piece of paper. Below are two examples. Achievement Criteria: Must meet Indicator A or B
Page 13 of 14 Client ID Number Indicator A (Achievement) Yes Yes No No No No Indicator B (Achievement) No Yes Yes No Yes No Outcome (Achievement) Yes Yes Yes No Yes No 1 2 3 4 5 6 Step 1: Identify each client by using an ID number or name. Step 2: Record whether they achieved Indicator A by writing “Yes” or “No” and repeat the process for Indicator B Step 3: Highlight the clients who have a “Yes” for Indicator A. Step 4: Highlight the clients who have a “Yes” for Indicator B. Step 5: If there is a “Yes” in either column, write “Yes” for Outcome achievement. Step 6: Highlight each “Yes” and sum. This is the number of clients who achieved either Indicator A or B. Achievement Criteria: Must meet Indicator A and B Client ID Number Indicator A (Achievement) (Achievement) 1 Yes 2 Yes 3 No 4 Yes 5 Yes 6 Yes Step 1: Identify each client by using an ID number or name. Step 2: Record whether they achieved Indicator A by writing “Yes” or “No” and repeat the process for Indicator B Step 3: Highlight the clients who have a “Yes” for Indicator A. Step 4: Highlight the clients who have a “Yes” for Indicator B. Step 5: If there is a “Yes” in both columns, write “Yes” for Outcome achievement. Step 6: Highlight each “Yes” and sum. This is the number of clients who achieved either Indicator A and B. Indicator B Outcome (Achievement) No Yes No No Yes No No Yes Yes No Yes No
Page 14 of 14 The Data Collection Worksheet is used to profile each item of your OBE system, once your agency has a working OBE system in place. This profile is the basis of the components mentioned above, and is used as contractual audit form. The DCW information may suffice as a desk audit, or be used for an onsite monitoring guide. This guide along with a monitoring scoring checklist to establish an evaluation score that is used in your funding application to the Cities of Tacoma and Lakewood, and to Pierce County. Agency Name:_________________________________________ Program Name: _______________________________________ Data Collection Worksheet OUTCOMES/CRITERIA Be sure to answer for each Outcome and Indicator Outcome 1 (State Here) Criteria to achieve outcome 1 (A&B, A or B, A only, etc. & provide a rationale for criteria other than A&B) Indicator A (State Here) Criteria to achieve indicator A (Example: Survey: Answer to Question #12 must increase by at least one point). Indicator B (State Here) Criteria to achieve indicator B (Example: Survey: Answer to Question #11 & #14 must be “Almost Always or Always”). Outcome 2 (State Here) Criteria to achieve outcome 2 (A&B, A or B, A only, etc. & provide a rationale for criteria other than A&B) Indicator A (State Here) Criteria to achieve indicator A (Example: Staff Observation: Positive behavior as defined in the guide must be exhibited at least 5 times per week). Indicator B (State Here) Criteria to achieve indicator B (Example: Case Records: Client completes action steps for at least 60% of goals listed in individual service plan). 9 pt. or larger Arial font allowed for this appearance DATA COLLECTION PROCESS DATA COLLECTION METHOD TOOLS VALIDITY Please attach copy of current tools. Discuss only the tools used to measure the outcomes and indicators listed on the left Outcome 1: (List tool and why selected) Outcome 2: (List tool and why selected) Process used to collect data Who - Who collects the Data? When – At what points in time is the data collected? Do you gather data on ALL Clients? YES or NO If NO, what SAMPLE STRATEGY do you use? (Random, Stratified, etc.) What is your RATIONALE for using the identified strategy? Identify step(s) to ensure (List the most important - at least one step for each tool) • (Please list out the steps – narrative is not necessary) Identify step(s) to ensure (List the most important - at least one step for each tool) • (Please list out the steps – narrative is not necessary) ⇑ ⇑ ⇑ ⇑ RELIABILITY