Download
1 / 7
70 likes | 72 Views
The requirement of both fecal and urinary diversions in recurrent cervical cancer and primary or advanced and recurrent rectal cancer mostly has made the series of changes in the techniques (1). First pelvic exenteration was done in advanced carcinoma cervix in 1948. The procedure includes ultra-radical surgery including urinary tract and bowel reconstruction. Morbidity and mortality are the important concerns with this procedure. Perioperative mortality was shown upto 12% cases with morbidity ranging from 50-85% (2). Again in recurrent carcinoma cervix cases who were mostly priorly radiated e

E N D
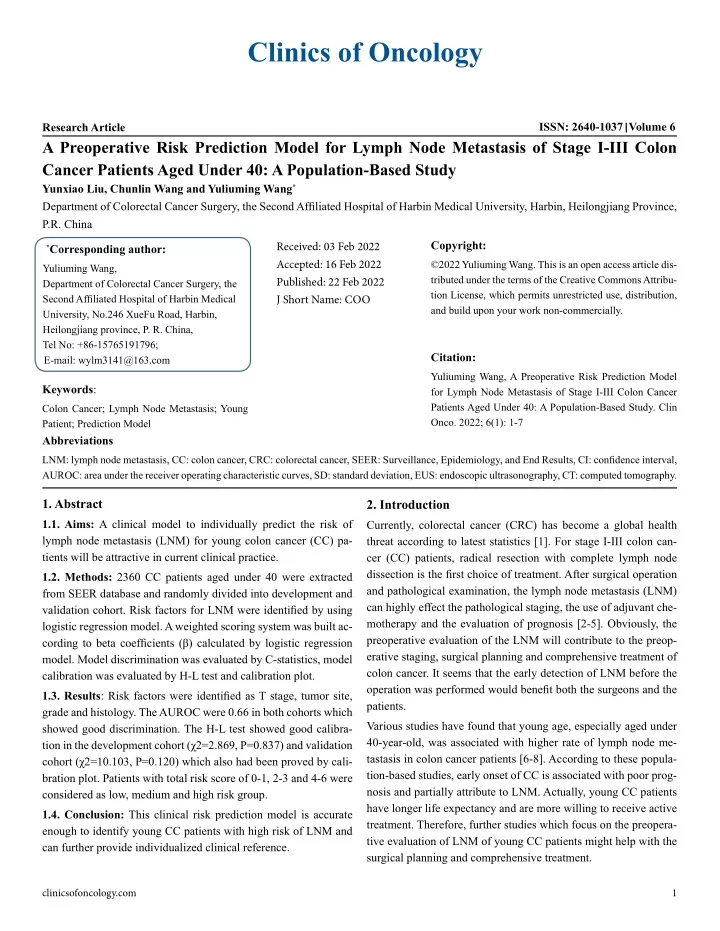
Clinics of Oncology ISSN: 2640-1037 Volume 6 Research Article A Preoperative Risk Prediction Model for Lymph Node Metastasis of Stage I-III Colon Cancer Patients Aged Under 40: A Population-Based Study Yunxiao Liu, Chunlin Wang and Yuliuming Wang* Department of Colorectal Cancer Surgery, the Second Affiliated Hospital of Harbin Medical University, Harbin, Heilongjiang Province, P.R. China Copyright: Received: 03 Feb 2022 Accepted: 16 Feb 2022 Published: 22 Feb 2022 J Short Name: COO *Corresponding author: ©2022 Yuliuming Wang. This is an open access article dis- tributed under the terms of the Creative Commons Attribu- tion License, which permits unrestricted use, distribution, and build upon your work non-commercially. Yuliuming Wang, Department of Colorectal Cancer Surgery, the Second Affiliated Hospital of Harbin Medical University, No.246 XueFu Road, Harbin, Heilongjiang province, P. R. China, Tel No: +86-15765191796; E-mail: wylm3141@163.com Citation: Yuliuming Wang, A Preoperative Risk Prediction Model for Lymph Node Metastasis of Stage I-III Colon Cancer Patients Aged Under 40: A Population-Based Study. Clin Onco. 2022; 6(1): 1-7 Keywords: Colon Cancer; Lymph Node Metastasis; Young Patient; Prediction Model Abbreviations LNM: lymph node metastasis, CC: colon cancer, CRC: colorectal cancer, SEER: Surveillance, Epidemiology, and End Results, CI: confidence interval, AUROC: area under the receiver operating characteristic curves, SD: standard deviation, EUS: endoscopic ultrasonography, CT: computed tomography. 1. Abstract 2. Introduction 1.1. Aims: A clinical model to individually predict the risk of lymph node metastasis (LNM) for young colon cancer (CC) pa- tients will be attractive in current clinical practice. Currently, colorectal cancer (CRC) has become a global health threat according to latest statistics [1]. For stage I-III colon can- cer (CC) patients, radical resection with complete lymph node dissection is the first choice of treatment. After surgical operation and pathological examination, the lymph node metastasis (LNM) can highly effect the pathological staging, the use of adjuvant che- motherapy and the evaluation of prognosis [2-5]. Obviously, the preoperative evaluation of the LNM will contribute to the preop- erative staging, surgical planning and comprehensive treatment of colon cancer. It seems that the early detection of LNM before the operation was performed would benefit both the surgeons and the patients. 1.2. Methods: 2360 CC patients aged under 40 were extracted from SEER database and randomly divided into development and validation cohort. Risk factors for LNM were identified by using logistic regression model. A weighted scoring system was built ac- cording to beta coefficients (β) calculated by logistic regression model. Model discrimination was evaluated by C-statistics, model calibration was evaluated by H-L test and calibration plot. 1.3. Results: Risk factors were identified as T stage, tumor site, grade and histology. The AUROC were 0.66 in both cohorts which showed good discrimination. The H-L test showed good calibra- tion in the development cohort (χ2=2.869, P=0.837) and validation cohort (χ2=10.103, P=0.120) which also had been proved by cali- bration plot. Patients with total risk score of 0-1, 2-3 and 4-6 were considered as low, medium and high risk group. Various studies have found that young age, especially aged under 40-year-old, was associated with higher rate of lymph node me- tastasis in colon cancer patients [6-8]. According to these popula- tion-based studies, early onset of CC is associated with poor prog- nosis and partially attribute to LNM. Actually, young CC patients have longer life expectancy and are more willing to receive active treatment. Therefore, further studies which focus on the preopera- tive evaluation of LNM of young CC patients might help with the surgical planning and comprehensive treatment. 1.4. Conclusion: This clinical risk prediction model is accurate enough to identify young CC patients with high risk of LNM and can further provide individualized clinical reference. clinicsofoncology.com 1
Volume 6 Issue 1 -2022 Research Article splenic flexure, descending colon and sigmoid colon were defined as left-sided colon cane, and the cecum, ascending colon, hepatic flexure and proximal transverse colon (proximal two-thirds of the transverse colon) were defined as right-sided colon cancer [9-10]. The tumor located in rectosigmoid was excluded. Individualized prediction of high risk of developing certain dis- ease and identification of novel risk factors could be achieved by the risk prediction model [9]. Preoperative evaluation of young CC patients with high risk of LNM by prediction model would be a new attempt. However, relevant study was still lacking. Here, by using population-based data, we attempted to develop and validate a preoperative risk prediction model for LNM of stage I-III CC patients aged under 40 which might provide useful reference for surgeons and physicians. 3. Materials & Methods Supplementary Table 1: Comparison of baseline characteristics between development cohort and validation cohort. Validation cohort (N=1180) Development cohort (N=1180) Characteristics P value Gender 0.681 3.1. Data Source Female 585 (49.6) 595 (50.4) The data used in this study were extracted from the Surveillance, Epidemiology, and End Results (SEER) database and had been used in our previous study regarding young CC patients [10]. The SEER database represents 28% of the US population and includes information on cancer incidence, survival outcomes and treatment strategies from 17 population-based cancer registries [10]. We had acquired permission from the National Cancer Institute to ex- tract data file from the SEER database with the reference number 10249-Nov2015. Ethics Committee of the institution of all authors has approved the study design. All methods were carried out in accordance with the Declaration of Helsinki and the approved guidelines. Male 595 (50.4) 585 (49.6) Race 0.723 White 871 (73.8) 887 (75.1) Black 161 (13.6) 156 (13.2) Others 148 (12.6) 137 (12.7) Age 0.303 20-24 years 57 (4.8) 62 (5.3) 25-29 years 155 (13.1) 124 (10.5) 30-34 years 345 (29.3) 331 (28.1) 35-39 years 623 (52.8) 633 (56.1) 3.2. Study Design Tumor site 0.323 2360 patients aged 20-40 were extracted from the SEER database. All patients were in stage I-III, the first choice of treatment was radical resection. Patients underwent preoperative chemoradio- therapy were excluded since the treatment would reduce the num- ber of node involvement. We also excluded patients with incom- plete information or underwent local excision. Right-sided colon 560 (47.5) 585 (49.6) Left-sided colon 620 (52.5) 595 (50.4) Tumor size 0.408 < 5 cm 522 (44.2) 542 (45.9) ≥ 5 cm 658 (55.8) 638 (54.1) By using statistical software package SPSS 22.0, 2360 patients were randomly divided into two cohorts with a ratio of 1:1. Half of the patients was divided into development cohort (N=1180) to set up the model while the other half was divided into validation co- hort (N=1180) to validate this model. The comparison of baseline characteristics of both cohorts was shown in Supplementary Table 1 with no significant difference between two cohorts. T stage 0.817 T1/T2 206 (17.5) 216 (18.3) T3 787 (66.7) 773 (65.5) T4 187 (15.8) 191 (16.2) Grade 0.077 865 (73.3) 903 (76.5) Ⅰ-Ⅱ 3.3. Candidate Predictors 315 (26.7) 277 (23.5) Ⅲ-Ⅳ Risk factors were age (category as 20-24, 25-29, 30-34, 35-39 years old), gender (category as male and female), race (category as white, black and others), tumor site (category as right-sided colon and left-sided colon), tumor size (category as <5 cm and ≥5 cm), T stage (category as T1/T2, T3 and T4), grade (category as I/II and III/IV) and histology (category as adenocarcinoma, mucinous/ signet-ring cell and others) in this study. Histology 0.866 Adenocarcinoma 862 (73.1) 859 (72.8) Mucinous/Signet-ring cell 168 (14.2) 163 (13.8) Others 150 (12.7) 158 (13.4) No. of nodes examined 1 < 12 118 (10.0) 118 (10.0) The definition of right-sided colon and left-sided colon lesion was in accord with previous study. Based on the location of the tumor, the distal transverse colon (distal one-third of the transverse colon), ≥ 12 1062 (90.0) 1062 (90.0) No. of positive nodes 633 (53.6) 598 (50.7) 0.149 clinicsofoncology.com 2
Volume 6 Issue 1 -2022 Research Article 3.4. Logistic Regression Model Calibration plot was drawn based on the observed rate and predict- ed rate [11]. Patients were divided into different score groups with the interval of two or three points according to their total risk score [11]. The observed rate is the actual lymph node metastatic rate of each group. The predicted rate for each group can be calculated by the mean prediction rate and the standard deviation (SD). Finally, the calibration effect of the model was tested by comparing the predicted rate of each group with the actual rate of each group and draw the calibration plot. This model was built using a maximum likelihood estimation method based on adaptive summation, which used a logistic re- gression model to predict the risk of LNM [11]. This full-model approach avoids overfitting and selection bias that occurs in risk models based on univariate analysis by using a small number of pre-established candidate variables [12]. Each predictor in the model is associated with a score based on the beta coefficient (β). The beta coefficient was calculated by logistic regression model to develop a weighted point system to individually predict the risk of LNM for newly diagnosed young CC patients. The score for each significant predictor was summed to calculate the total risk score of each patient. The insignificant predictors in the logistic regression model (P≥0.05) received 0 point. The predictor with the minimum β received 1 point. The scores of other predictors were calculated by dividing the β of each predictor by the lowest β in the model, and rounding to the nearest whole number [9,11]. In addi- tion, the logistic regression model could also provide the predicted rate of each patient which would be used in further analysis. 3.5. Statistical Analysis In development cohort and validation cohort, the characteristics between patients with and without LNM were compared by us- ing Chi-square test or Fisher’s exact test. Then, multivariate lo- gistic regression model incorporating variables associated with LNM (P<0.05). The statistical software package SPSS 22.0 (IBM Corp, Armonk, NY, USA) was used to perform statistical analysis. P<0.05 was considered as statistical significant. 4. Results 4.1. Univariate and Multivariate Analysis of the Development Cohort Discrimination is assessed by using C-statistics and the area under the receiver operating characteristic curve (AUROC), which is de- fined as the ability of the predictive model to distinguish between those who have not experienced the event and those who have ex- perienced it. Logistic regression model was used to calculate the overall C-statistics and its 95% confidence interval (CI) [13]. In development cohort, univariate analysis was carried out to eval- uate predictors associated with LNM. Tumor site (P=0.001), T stage (P<0.001), grade (P<0.001) and histology (P=0.001) were found to have significant outcome (Table 1). The four predictors were enrolled into logistic regression model to perform multivar- iate analysis. Logistic regression analysis showed that these four predictors were significantly associated with LNM of young CC patients, and the score of each predictor was calculated by meth- ods described above (Table 2). Besides, the predicted rate and total risk score of each patient was also calculated by the model for further analysis. Calibration is used to test the degree of agreement between pre- dicted and actual results, and it is another measure of the perfor- mance of the prediction model [9]. Calibration was assessed by H-L test and calibration plot. H-L test was calculated by the logis- tic regression model and P>0.05 remained the model fitted well. Table 1: Univariate analysis of development cohort. Characteristics Total number No. of positive nodes P value Gender 0.742 Female 585 (49.6) 311 (53.1) Male 595 (50.4) 322 (54.1) Race 0.206 White 871 (73.8) 456 (52.3) Black 161 (13.6) 88 (54.6) Others 148 (12.6) 89 (60.1) Age 0.493 20-24 years 57 (4.8) 36 (63.1) 25-29 years 155 (13.1) 84 (54.1) 30-34 years 345 (29.3) 180 (52.1) 35-39 years 623 (52.8) 333 (53.4) Tumor site 0.001 Right-sided colon 560 (47.5) 272 (48.5) clinicsofoncology.com 3
Volume 6 Issue 1 -2022 Research Article Left-sided colon 620 (52.5) 361 (58.2) Tumor size 0.377 < 5 cm 522 (44.2) 288 (55.1) ≥ 5 cm 658 (55.8) 345 (52.4) T stage <0.001 T1/T2 206 (17.5) 65 (31.5) T3 787 (66.7) 437 (55.5) T4 187 (15.8) 131 (70.0) Grade <0.001 865 (73.3) 427 (49.3) Ⅰ-Ⅱ 315 (26.7) 206 (65.3) Ⅲ-Ⅳ Histology 0.001 Adenocarcinoma 862 (73.1) 476 (55.2) Mucinous/Signet-ring cell 168 (14.2) 98 (58.3) Others 150 (12.7) 59 (39.3) Table 2: Logistic regression analysis of development cohort. Characteristics Adjusted OR (95% CI) Risk score P value β coefficient T stage <0.001 T1/T2 1.0 (ref) - T3 2.4 (1.7-3.3) 0.86 1 T4 4.2 (2.7-6.5) 1.43 3 Grade <0.001 1.0 (ref) - Ⅰ-Ⅱ 1.7 (1.3-2.2) 0.52 1 Ⅲ-Ⅳ Histology 0.015 Others 1.0 (ref) - Mucinous/Signet-ring cell 1.7 (1.0-2.7) 0.51 1 Adenocarcinoma 1.6 (1.1-2.3) 0.47 1 Tumor site 0.001 Right-sided colon 1.0 (ref) - Left-sided colon 1.7 (1.3-2.1) 0.51 1 The results were shown in (Table 3 and Table 4) which reflected that the significance of these four predictors were well validated in validation cohort. According to the scoring system established in the development cohort, the total risk score of each patient was also calculated in validation cohort. The predicted rate of valida- tion cohort was also calculated by logistic regression model. 4.2. Univariate and Multivariate Analysis of the Validation Co- hort Since tumor site, T stage, grade and histology had been identified as risk factors for LNM of young CC patients by development co- hort, in validation cohort, only the above four predictors were used to perform the univariate and multivariate analysis. clinicsofoncology.com 4
Volume 6 Issue 1 -2022 Research Article Table 3: Univariate analysis of validation cohort. Characteristics Total number No. of positive nodes P value Tumor site 0.017 Right-sided colon 585 (49.6) 276 (47.1) Left-sided colon 595 (50.4) 322 (54.1) T stage <0.001 T1/T2 216 (18.3) 64 (29.6) T3 773 (65.5) 401 (52.0) T4 191 (16.2) 132 (69.1) Grade <0.001 903 (76.5) 416 (46.0) Ⅰ-Ⅱ 277 (23.5) 182 (65.7) Ⅲ-Ⅳ Histology 0.007 Adenocarcinoma 859 (72.8) 436 (50.7) Mucinous/Signet-ring cell 163 (13.8) 99 (60.7) Others 158 (13.4) 63 (39.8) Table 4: logistic regression analysis of validation cohort. Characteristics Adjusted OR (95% CI) P value T stage <0.001 T1/T2 1.0 (ref) T3 2.4 (1.7-3.4) T4 4.4 (2.8-6.9) Grade <0.001 1.0 (ref) Ⅰ-Ⅱ 1.9 (1.4-2.6) Ⅲ-Ⅳ Histology 0.035 Others 1.0 (ref) Mucinous/Signet-ring cell 1.7 (1.1-2.7) Adenocarcinoma 1.1 (1.0-1.7) Tumor site 0.001 Right-sided colon 1.0 (ref) Left-sided colon 1.5 (1.2-2.0) 4.3. Discrimination and Calibration (χ2=2.869, P=0.837) and validation cohort (χ2=10.103, P=0.120) showed that the model fitted well. In both cohorts, the minimum total risk score was 0 while the maximum was 6. Here, patients were divided into score group of 0-1, 2-3 and 4-6 in both cohorts. Calibration plot was drawn by comparing the observed rate and predicted rate in each score group (Figure 1). According to the plot, all observed rate was included in the interval of predicted rate which reflected that the model fitted well. C-statistics were performed by logistic regression model of each cohort and the area under the receiver operating characteristic curves (AUROC) (95% CI) of development cohort and validation cohort were 0.66 (0.63-0.69) and 0.66 (0.62-0.69) which showed good discrimination. Calibration was evaluated by Hosmer-Lemeshow (H-L) test and calibration plot. The results of H-L test of development cohort clinicsofoncology.com 5
Volume 6 Issue 1 -2022 Research Article Figure 1: Observed rate and predicted rate of patients according to different score group. reflected that the risk of LNM was significantly different between score groups (Supplementary Table 2). We also validated the dif- ference between score groups in validation cohort. Thus, patients in score group 0-1, 2-3 and 4-6 were defined as low, medium and high risk group in this study. 4.4. Category of Risk Group According to the score group of the development cohort, we found that the predicted rate of score group 4-6 (70.5±6.1 %) was nearly triple of the predicted rate of score group 0-1 (27.7±4.7 %) which Supplementary Table 2: Observed rate and predicted rate of patients according to different score group. Development cohort (%) Validation cohort (%) Score group Observed rate Predicted rate Observed rate Predicted rate 0-1 25.8 27.7 ± 4.7 32 28.2 ± 6.6 2-3 53.3 52.8 ± 7.7 48.5 49.2 ± 8.5 4-6 75.2 70.5 ± 6.1 69.5 69.7 ± 7.1 searchers have found that patients with poor-differentiated tumor or deep invasion tumor were more likely to have lymph node me- tastasis [16-17]. Here, we found that patients with left-sided CC were more likely to have LNM, it might attribute to circulating immune cells according to previous study [18]. However, relevant research was still lacking and the conclusion could not be made. Finally, patients with Adenocarcinoma and Mucinous/Signet-ring cell were more likely to have LNM than other types of histology which also require further study to validate and explain. 5. Discussion Early onset CC patients, especially aged under 40 might have poor prognosis and contributed to lymph node metastasis [6-8]. The identification of high risk patients in preoperative evalua- tion would help with the application of surgical treatment and the comprehensive treatment of CC. Since the prediction model has been widely used in clinical research and its advantage in iden- tifying risk factors and high risk patients for certain disease, we performed this model based on population-based data to find out high risk patients with LNM among young CC patients. The calibration plot could visually present the fitting degree of ob- served and predicted rate in this study. Based on the calibration plot, we further analyzed the predicted rate between different score groups. Since there is no strict and clear definition of the inter- val of score groups and the difference between high and low risk group, we decide to use the methods extracted from previous stud- ies [9,11]. We hypothesis that the predicted rate of high risk group should almost three times of the predicted rate of low risk group. The results of development cohort and validation cohort were in accord with the hypothesis. Thus, the score group was defined as 0-1, 2-3 and 4-6. The three groups were further defined as low, me- dium and high risk group. The detection of predictors of LNM and the definition of risk group was the final conclusion of this study. In this study, candidate predictors were the baseline characteristics of CC patients and can be easily obtained from SEER database. These factors could also be obtained from clinical practice since the colonoscopy and pathological examination could evaluate the tumor site, grade and histology. The tumor size and T stage could be evaluated by endoscopic ultrasonography (EUS) and/or com- puted tomography (CT) scan. Thus, we use these candidate pre- dictors to establish a clinical prediction model will be better for application in clinical practice. According to the results of logistic regression model, T stage, grade, histology and tumor site were identified as risk factors of LNM. Previous studies have found that LNM of CC could be pre- dicted by histopathological markers. Tumor stage and grade are well-recognized predictors as well as in this study [14-15]. Re- This model could provide useful reference for surgeons and phy- sicians. For high risk group patients, enhanced CT scan with more clinicsofoncology.com 6
Volume 6 Issue 1 -2022 Research Article cost would be useful to determine the lymph node status and tumor invasion, the surgical plan might be revised to extended resection according to the results. In addition, the false-negative of lymph node metastasis in clinical practice should not be ignored. For high risk group patients, more nodes should be retrieved by team work of surgeons and pathologists and a thorough examination should be performed. However, we should know that the model only pro- vide reference but not guideline, the final medical decision might be made according to the actual condition of the patients, the ref- erence of this model and the choice of the patients and surgeons. the US Military Health System. Dis Colon Rectum. 2020; 63: 346- 56. 8. Frostberg E, Rahr HB. Clinical characteristics and a rising incidence of early-onset colorectal cancer in a nationwide cohort of 521 pa- tients aged 18-40 years. Cancer Epidemiol. 2020; 66: 101704. 9. Wang Y, Guan X, Zhang Y, Zhao Z, Gao Z, Chen H, et al., A Preoper- ative Risk Prediction Model for Lymph Node Examination of Stage I-III Colon Cancer Patients: A Population-Based Study. J Cancer. 2020; 11: 3303-9. 10. Guan X, Wang Y, Hu H, Zhao Z, Jiang Z, Liu Z, et al., Reconsider- ation of the optimal minimum lymph node count for young colon cancer patients: a population-based study. BMC Cancer. 2018; 18: 623. Last but not the least, the AUROC of both cohorts were 0.66 which showed good discrimination. The discrimination would be better if the AUROC was more than 0.7, which was one of the limitation of this study. Another limitation might be the lack of sufficient pre- dictors, which would attribute to the limited recording information in the SEER database, further studies should contain tumor bio- markers and other relevant factors. Since SEER only represent part of the US population and this study is a retrospective study, the selection bias could not be avoided, either. Despite these limita- tion, this study firstly developed and validated a preoperative risk prediction model of LNM for stage I-III CC patients aged under 40 based on population-based data. The identification of risk factors and the scoring system would not only inspire the following stud- ies but also provide useful reference for surgeons and physicians. 11. Jorgensen ML, Young JM, Dobbins TA, Solomon MJ. A mortality risk prediction model for older adults with lymph node-positive co- lon cancer. Eur J Cancer Care (Engl). 2015; 24: 179-88. 12. Royston P, Moons KGM, Altman DG, Vergouwe Y. Prognosis and prognostic research: Developing a prognostic model. BMJ. 2009; 338: b604. 13. Lee SJ, Lindquist K, Segal MR, Covinsky KE. Development and validation of a prognostic index for 4-year mortality in older adults. JAMA. 2006; 295: 801-8. 14. Huh JW, Lee WY, Shin JK, Park YA, Cho YB, Kim HC, et al., A novel histologic grading system based on lymphovascular invasion, perineural invasion, and tumor budding in colorectal cancer. J Can- cer Res Clin Oncol. 2019; 145: 471-7. In conclusion, this study developed and validated a preoperative risk prediction model of LNM for stage I-III CC patients aged un- der 40. This clinical risk prediction model is accurate enough to identify the young CC patients with high risk of LNM and to fur- ther provide individualized clinical reference. 15. Oh JR, Park B, Lee S, Han KS, Youk EG, Lee DH, et al., Nomogram Development and External Validation for Predicting the Risk of Lymph Node Metastasis in T1 Colorectal Cancer. Cancer Res Treat. 2019; 51: 1275-84. Reference 16. Lee YJ, Huh JW, Shin JK, Park YA, Cho YB, Kim HC, et al., Risk factors for lymph node metastasis in early colon cancer. Int J Col- orectal Dis. 2020; 35: 1607-13. 1. Siegel RL, Miller KD, Fuchs HE, Jemal A. Cancer Statistics, 2021. CA Cancer J Clin. 2021; 71: 7-33. 17. Xu Y, Chen Y, Long C, Zhong H, Liang F, Huang LX, et al., Preop- erative Predictors of Lymph Node Metastasis in Colon Cancer. Front Oncol. 2021; 11: 667477. 2. Lykke J, Roikjaer O, Jess P, Danish Colorectal Cancer Group. The relation between lymph node status and survival in stage I-III colon cancer: results from a prospective nationwide cohort study. Colorec- tal Dis. 2013; 15: 559-65. 18. Di J, Zhuang M, Yang H, Jiang B, Wang Z, Su X. Clinical signifi- cance of circulating immune cells in left- and right-sided colon can- cer. PeerJ. 2017; 5: e4153. 3. Ong MLH, Schofield JB. Assessment of lymph node involvement in colorectal cancer. World J Gastrointest Surg. 2016; 8: 179-92. 4. Dedavid e Silva TL, Damin DC. Lymph node ratio predicts tumor recurrence in stage III colon cancer. Rev Col Bras Cir. 2013; 40: 463-70. 5. Mroczkowski P, Schmidt U, Sahm M, Gastinger I, Lippert H, Kube R. Prognostic factors assessed for 15,096 patients with colon cancer in stages I and II. World J Surg. 2012; 36: 1693-8. 6. Xie X, Yin J, Zhou Z, Dang C, Zhang H, Zhang Y. Young age in- creases the risk for lymph node metastasis in patients with early Colon Cancer. BMC Cancer. 2019; 19: 803. 7. Alexander MS, Lin J, Shriver CD, McGlynn KA, Zhu K. Age and Lymph Node Positivity in Patients with Colon and Rectal Cancer in clinicsofoncology.com 7