Download
1 / 16
160 likes | 465 Views
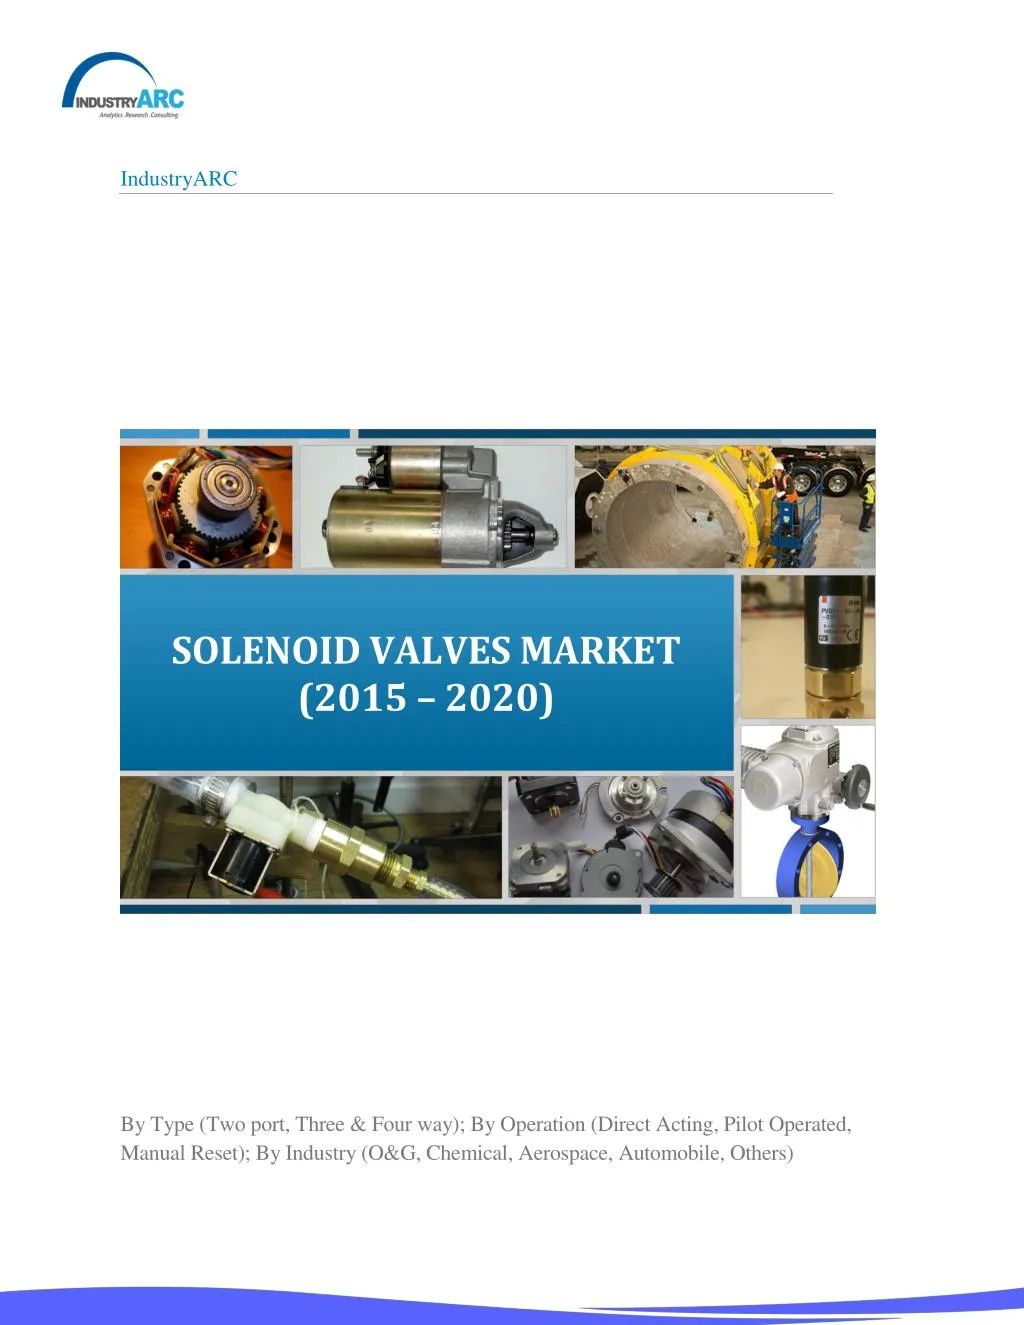
Increasing Industrialization Opportunities in APAC region to drive the Solenoid Valves market at a CAGR of 3.8% till 2020<br><br>The Report “Solenoid Valves Market Analysis: By Types (Two port, Three-way, Four-way, Direct Acting, Pilot operated); By Industry (Water Treatment, Power, Pulp & Paper, Food & Beverage, Chemical) - With Forecast (2015 - 2020)”, published by IndustryARC, the market to grow at a CAGR of 3.8% till 2020<br><br>Browse 31 Market Tables, 56 Figures spread through 164 Pages and an in-depth TOC on “Solenoid Valves Market” http://industryarc.com/pdfdownload.aspx?id=1273<br>

E N D
IndustryARC SOLENOID VALVES MARKET (2015 – 2020) By Type (Two port, Three & Four way); By Operation (Direct Acting, Pilot Operated, Manual Reset); By Industry (O&G, Chemical, Aerospace, Automobile, Others)
To Enquire About the Report Click Here TABLE OF CONTENTS 1Solenoid Valves – Market Overview 2Executive Summary 3Solenoid Valves – Market Landscape 3.1Market Share Analysis 3.2Comparative Analysis 3.2.1Product Benchmarking 3.2.2End User Industry Profiling 3.2.3Top Five Financial Analysis 4Solenoid Valves – Market Landscape 4.1Market Drivers 4.2Market Constraints & Challenges 4.2.1Reduction In Oil & Gas Price and Drop In Oil Field Count 4.2.2Budget Allocation Is Limiting The Solenoid Valve Market 4.3Attractiveness of The Solenoid Valve Industry 4.3.1Power of Suppliers 4.3.2Threats From New Entrants 4.3.3Power of Buyer 4.3.4Threat From Substitute Product 4.3.5Degree of Competition 5Solenoid Valves Market – Strategic Analysis 5.1Solenoid Valve Market - Value Chain Analysis 5.2Pricing Analysis 5.3Opportunity Analysis 5.3.1R&D Developments In Solar Power Generation To Provide Huge Growth Opportunity For Solenoid Valve Market 5.3.2Increasing Production of Shale Gas to Drive Solenoid Valve Market 5.3.3Marine Solar Power 5.4Product Life Cycle 5.5Suppliers and Distributors 5.6SWOT Analysis 6Solenoid Valves Market – By Types
To Enquire About the Report Click Here 6.1Introduction 6.2Two Way Solenoid Valves 6.3Three Way Solenoid Valves Comprise Three Ports 6.4Four Way Solenoid Valves 6.5Others 7Solenoid Valves Market – By Components 7.1Introduction 7.2Coil / Solenoid 7.3Plunger 7.4Orifice 7.5Spring 7.6Seal 7.7Others 8Solenoid Valves Market – By Seals 8.1Introduction 8.2Nitrile Rubber (NBR) 8.3Ethylene Propylene Diene Monomer (EPDM) Rubber 8.4Fluroelastomer (FKM) 8.5Polytetrafluoroethylene (PTFE) 9Solenoid Valves Market- By Operation 9.1Direct Acting Valves 9.2Pilot Operated Valves 9.3Manual Reset Valves 10Solenoid Valves Market- By Industry 10.1Aerospace and Defense 10.2Automobile 10.3Oil & Gas 10.4Mining 10.5Water Treatment 10.6Chemical and Petrochemical Industry 10.7Pulp and Paper: 10.8Food & Beverage 10.9Power Generation
To Enquire About the Report Click Here 10.10Others 11Segmentation By Geography 11.1Americas 11.1.1U.S. 11.1.2Canada 11.1.3Mexico 11.1.4Brazil 11.2Europe 11.2.1U.K. 11.2.2Germany 11.2.3Italy 11.3Asia 11.3.1China 11.3.2South Korea 11.3.3Japan 11.3.4India 11.4Row 11.4.1Mea 11.4.2Oceania 12Market Entropy 12.1New Product Developments 12.2Mergers and Acquisitions 13Company Profile 13.1AIRTAC International Group 13.1.1Business Overview 13.1.2Financials 13.1.3Products 13.1.4Developments 13.2Pentair Ltd. 13.2.1Business Overview 13.2.2Financials 13.2.3Products 13.2.4Strategy
To Enquire About the Report Click Here 13.2.5Developments 13.3ROTORK PLC 13.3.1Business Overview 13.3.2Financials 13.3.3Products 13.3.4Developments 13.4NORGEN Inc. (IMI Precision Engineering) 13.4.1Business Overview 13.4.2Financials 13.4.3Products 13.4.4Strategy 13.4.5Developments 13.5Parker Hannifin 13.5.1Business Overview 13.5.2Financials 13.5.3Products 13.5.4Strategy 13.5.5Developments 13.6ASCO Valve Inc. (Emersion Electric Company) 13.6.1Business Overview 13.6.2Financials 13.6.3Products 13.6.4Strategy 13.6.5Developments 13.7Danfoss A/S 13.7.1Business Overview 13.7.2Financials 13.7.3Products 13.7.4Strategy 13.7.5Developments 13.8Curtiss-Wright Corporation 13.8.1Business Overview 13.8.2Financials 13.8.3Products And Services 13.8.4Developments
To Enquire About the Report Click Here 13.9Burkert Fluid Control Systems 13.9.1Business Overview 13.9.2Financials 13.9.3Products 13.9.4Strategy 13.9.5Developments 13.10Kingston Valves 13.10.1Business Overview 13.10.2Financials 13.10.3Products 13.10.4Developments 13.11SMC Corporation 13.11.1Business Overview 13.11.2Financials 13.11.3Products 13.11.4Developments 13.12ODE Solenoid Valves 13.12.1Business Overview 13.12.2Financials 13.12.3Products 13.12.4Developments
To Enquire About the Report Click Here LIST OF TABLES Table 1 Global Solenoid Valve Top Manufacturers Rankings, 2014 Table 2 Solenoid Valves Financial Analysis, By Company, 2014($M, Except For EPS) Table 3 Global Solenoid Valves Market, By Types, 2014-2020 ($M) Table 4 Three Way Solenoid Valves Market, By Regions, 2014-2020 ($M) Table 5 Four Way Solenoid Valves Market, By Regions, 2014-2020 ($M) Table 6 Global Solenoid Valves Market, By Operation, 2014 - 2020 ($M) Table 7 Global Solenoid Valves Market, By Industry Verticals, 2014 2020 ($M) Table 8 Global Aerospace Solenoid Valves Market, By Type, 2014 - 2020 ($M) Table 9 Global Automobile Solenoid Valves Market, By Type, 2014 - 2020 ($M) Table 10Global Oil & Gas Solenoid Valves Market, By Type, 2014 - 2020 ($M) Table 11Global Mining Solenoid Valves Market, By Type, 2014 - 2020 ($M) Table 12Global Water Treatment Solenoid Valves Market, By Type, 2014 - 2020 ($M) Table 13Global Chemical & Petrochemical Solenoid Valves Market, By Type, 2014 - 2020 ($M) Table 14Global Paper & Pulp Solenoid Valves Market, By Type, 2014 - 2020 ($M) Table 15Global Food & Beverage Solenoid Valves Market, By Type, 2014 - 2020 ($M) Table 16Global Power Generation Solenoid Valves Market, By Type, 2014 - 2020 ($M) Table 17Global Others Solenoid Valves Market, By Type, 2014 - 2020 ($M) Table 18Global Solenoid Valves Market, By Region, 2014-2020 ($M) Table 19Americas Solenoid Valves Market, By Industry Vertical, 2014-2020 ($M) Table 20Europe Solenoid Valves Market, By Industry Vertical, 2014-2020 ($M) Table 21Europe Solenoid Valves Market, By Country, 2014-2020 ($M) Table 22Asia Solenoid Valves Market, By Industry Vertical, 2014-2020 ($M) Table 23Asia Solenoid Valves Market, By Country, 2014-2020 ($M) Table 24Row Solenoid Valves Market, By Industry Vertical, 2014-2020 ($M) Table 25Row Solenoid Valves Market, By Industry Vertical, 2014-2020 ($M)
To Enquire About the Report Click Here Table 26Global Solenoid Valves Market: Key Product Launches Table 27Global Solenoid Valves Market: Key Mergers & Acquisitions Table 28Pentair Ltd: Total Revenue, By Geography, 2012– 2014 ($M) Table 29Emerson Electric Co.: Total Revenue, By Geography, 2012– 2014 ($M) Table 30Danfoss A/S Revenue, By Geography, 2013– 2014 ($M) Table 31Curtiss-Wright Corp: Total Revenue, By Geography, 2013– 2014 ($ Thousands)
To Enquire About the Report Click Here LIST OF FIGURES Figure1 Solenoid Valves Market – By Types Analysis Figure2 Solenoid Valves Market – By Key Components Figure3 Solenoid Valves Market – By Industry Verticals Figure4 Global Solenoid Valves Market Revenue, By Product Type, 2014-2020 ($BN) Figure5 Global Solenoid Valve Market Revenue, By Geography, 2014(%) Figure6 Global Solenoid Valves Market, By Industrial End User Segments, 2014 (%) Figure7 U.S. Field Production of Crude Oil, 2008 - 2014 (‘000 Barrels) Figure8 Estimated Asp Change of Low-End Solenoid Valves, 2015-2020 (%) Figure9 Estimated Asp Change of Mid-End Solenoid Valves, 2015-2020 (%) Figure10Estimated Asp Change of High-End Solenoid Valves, 2015-2020 (%) Figure11Two Way Solenoid Valves Market, By Regions, 2014-2020 ($M) Figure12Other Solenoid Valves Market, By Regions, 2014-2020 ($M) Figure13Solenoid Valves Market, Classification By Components Figure14Solenoid Valves Market, Classification By Seals Figure15Global Direct Acting Solenoid Valves Market, By Region, 2014 - 2020 ($M) Figure16Global Pilot Operated Solenoid Valves Market, By Region, 2014 - 2020 ($M) Figure17Global Manual Reset Solenoid Valves Market, By Region, 2014 - 2020 ($M) Figure18U.S. Solenoid Valves Market, 2014-2020, ($M) Figure19Canada Solenoid Valves Market, 2014-2020, ($M) Figure20Mexico Solenoid Valves Market, 2014-2020, ($M) Figure21Brazil Solenoid Valves Market, 2014-2020, ($M) Figure22UK Solenoid Valves Market, 2014-2020, ($M) Figure23Germany Solenoid Valves Market, 2014-2020, ($M) Figure24Italy Solenoid Valves Market, 2014-2020, ($M) Figure25Others Solenoid Valves Market, 2014-2020, ($M) Figure26China Solenoid Valves Market, 2014-2020, ($M)
To Enquire About the Report Click Here Figure27Republic of Korea Solenoid Valves Market, 2014-2020, ($M) Figure28Japan Solenoid Valves Market, 2014-2020, ($M) Figure29India Solenoid Valves Market, 2014-2020, ($M) Figure30Others Solenoid Valves Market, 2014-2020, ($M) Figure31Mea Solenoid Valves Market, 2014-2020, ($M) Figure32Oceania Solenoid Valves Market, 2014-2020, ($M) Figure33Global Solenoid Valves Strategy Share, 2012-2015 (%) Figure34Global Solenoid Valves Developments, By Company, 2012-2015 (%) Figure35Global Solenoid Valves Product Launches, 2012-2015 (%) Figure36AIRTAC Group: Total Revenue, 2012-2014 ($M) Figure37AIRTAC Group: Total Revenue, By Products, 2014 (%) Figure38AIRTAC Group: Total Revenue, By Region, 2014 (%) Figure39Pentair Inc. Total Revenue, 2012- 2014 ($BN) Figure40Pentair Ltd.: Total Revenue, By Industry Segments, 2014 (%) Figure41ROTORK Plc. Total Revenue, 2012- 2014 ($M) Figure42ROTORK Plc. Total Revenue, By Segment, 2014 (%) Figure43IMI Group, Total Revenue, 2012- 2014 ($M) Figure44IMI Group, Total Revenue, By Segment, 2014 (%) Figure45IMI Group, Total Revenue, By Region, 2014 (%) Figure46Parker Hannifin Corporation: Total Revenue, 2012-2014 ($BN) Figure47Parker Hannifin Corporation: Total Revenue, By Segment, 2014 (%) Figure48Parker Hannifin Corporation: Diversified Industrial Segment Revenue,By Region, 2014 (%) Figure49Emersion Electric Company: Total Revenue, 2012-2014 ($M) Figure50Emerson Electric Co.: Total Revenue, By Industry Segments, 2014 (%) Figure51DANFOSS A/S: Total Revenue, 2012-2014 ($M)
To Enquire About the Report Click Here Figure52DANFOSS A/S: Total Revenue, By Segment, 2014 (%) Figure53Curtiss-Wright Corp: Total Revenue, 2013 – 2014 ($BN) Figure54Curtiss-Wright Corp.: Total Revenue, By Industry Segments, 2014 (%) Figure55SMC Corporation: Total Revenue, 2012-2014 ($M) Figure56SMC Corporation: Total Revenue, By Region (%)
To Enquire About the Report Click Here KEY INSIGHTS Main drivers for the Global Solenoid Valves market are: Automatic flow system, new control designs, low power consumption Demand for solenoid valves has been increased at a very high rate and it is due to change in technology Chemical Industry and Industrial products are the key industries for the development of new Industry verticals in the Global Solenoid Valves Development of new technologies with improved features and performance are set to drive the market Development of new solenoid valves such as customized valves, micro- miniature valves, pinch valves, manifolds, etc., have led to increased demand for fluid control needs Oil & gas, Chemical & Petrochemical and Power generation industries are the major contributors to the revenue generated this market contributing to almost 54% of the overall revenue in 2014. North America and Europe are estimated to occupy a share of more than 50% during 2014-2020
To Enquire About the Report Click Here RESEARCH METHODOLOGY The quantitative and qualitative data collected for the global Solenoid Valves report is from a combination of secondary and primary sources. Research interviews were conducted with executives and/or mangers in the key product manufacturers and related organizations. These Key Opinion Leaders (KOLs) were then provided a questionnaire to gather quantitative and qualitative inputs on their operations, performance, strategies and views on the overall market, including key developments and trends. Data from interviews is consolidated, checked for consistency and accuracy, and the final market numbers are again validated by experts. The global Solenoid Valves was split by, applications and geography based on different factors like primary and secondary sources, understanding of the number of companies operating in each segment and also KOL insights. We have used various secondary sources such as directories, articles, white papers, newsletters, annual reports and paid databases such as OneSource, Hoovers and Factiva to identify and collect information for extensive commercial study of the global Solenoid Valves. The approach towards finding information regarding the market and forecasting has been quite extensive. The key players in the market and its value chain were identified through secondary research and their market opinions were also gathered in a similar way through telephonic interviews and questionnaires. Interviews with key opinion leaders such as managers and marketing personnel were used extensively in understanding the need and emergence of solenoid valves market. We also have extensive database of contacts which were used to conduct primary interviews and also to get their inputs using questionnaires.
To Enquire About the Report Click Here THE ARC ADVANTAGE An analytical model lies at the core of our process, ensuring logical consistency throughout our research. We complement the model with secondary data and interviews with industry experts to reflect the latest trends. With our final expert validation, we provide you with only the most accurate and actionable intelligence. THE ARC PROCESS Base Method Analytical Method Consolidation Method Delphi Verification 1. Granular breakdown of drivers into factors 2. Validate all factors in terms of their present impact on the market 3. Assign weights to these factors in terms of their relevance and impact on the market 4. Build the Analytical Model 1. Get a top- down estimate of the market 2. Follow it up with a bottom-up estimate of the market 3. Check forconsistency and new growth factors that are relevant over the next 10 Years 4. Build the Base model 1. Granular breakdown of drivers into factors 2. Validate all factors in terms of their present impact on the market. 3. Assign weights to these factors in terms of their relevance and impact on the market. 4. Build the Consolidated Model 1. Verify the findings of the model with experts from across the value chain 2. Verify the findings with players across small and large enterprises 3. Tweak the model and add new factors 4. Finalize the ARC Model ANALYTICAL MODEL BASE MODEL CONSOLIDATED MODEL ARC MODEL
To Enquire About the Report Click Here ABOUT US IndustryARC was started by a group of young, passionate professionals along with extensively experienced industry veterans across various business segments. Our focus and expertise is mainly in the field of analytics, market research and consulting. Our singular goal is to provide accurate and affordable research to our clients. Our research team has expertise in diverse fields like Automotive, Chemicals,Consumer Product & Services, Electronics, Food & Beverages, Healthcare etc., However diverse the expertise maybe, everyone in our team shares one common trait - we love data and we love providing solutions to clients using that data even more! Seeing your business flourish based on our solutions and strategy is what we love the most! IndustryARC publishes more than 30 reports on an annual basis in the mentioned Industries. Our reports are in-depth and high quality reports that can help decision makers frame better strategies for their business requirements. These reports can be further customized as per your needs. Disclaimer: The reports sold by IndustryARC are limited publications containing valuable market information provided to a select group of customers in response to orders. Our customers acknowledge and agree that any report bought from IndustryARC is for their own internal use and not for general publication or disclosure to third parties. Our reports or part of the reports, information contained in the report, cannot be shared or resold to any other third party. Disclosure to third parties, usage of data in a public document, article or blog by the customer can be done with prior permission taken from IndustryARC. For information regarding permissions and sales, contact: sales@industryarc.com | sanjay.matthews@industryarc.com
To Enquire About the Report Click Here IndustryARC +1 614 - 588 - 8538 sales@industryarc.com Copyright ©2015 IndustryARC All Rights Reserved. This document contains highly confidential information and is the sole property of IndustryARC. No part of it may be circulated, copied, quoted, or otherwise reproduced without the approval of IndustryARC.