Download
1 / 24
0 likes | 2 Views
The US OTT market has grown exponentially in recent years, driven by the increasing availability of high-speed internet and the proliferation of smartphones.<br>Read More: https://us.sganalytics.com/whitepapers/us-ott-svod-the-new-frontier/

E N D
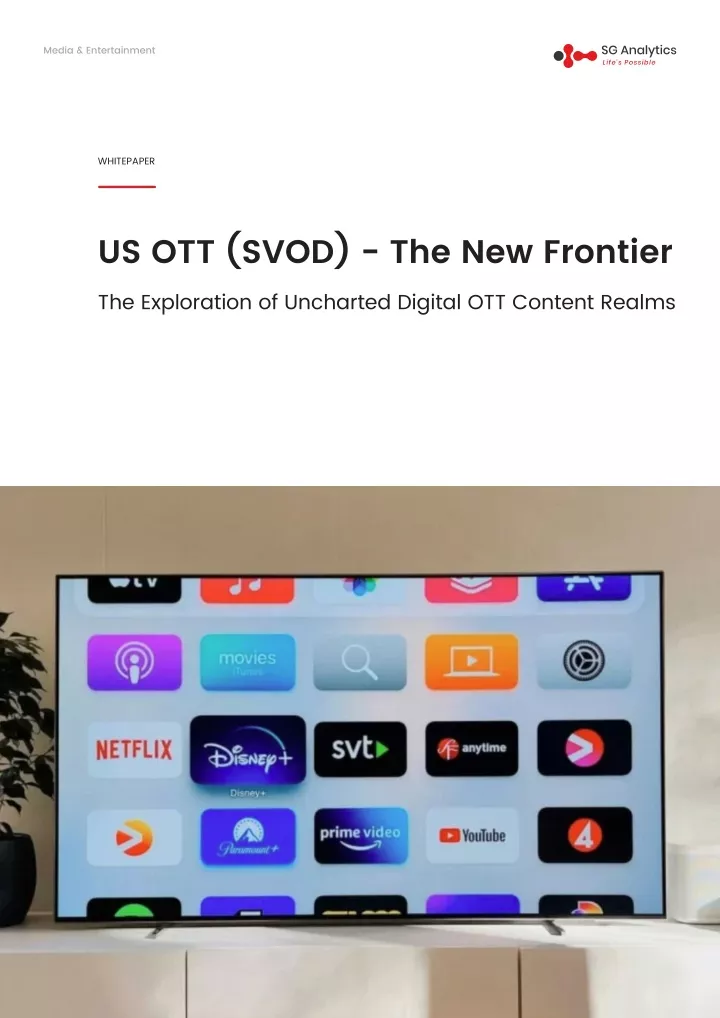
Media & Entertainment WHITEPAPER US OTT (SVOD) - The New Frontier The Exploration of Uncharted Digital OTT Content Realms
US OTT (SVOD) - The New Frontier CONTENTS Executive Summary 03 Brand Perception Study 04 Changing Subscription Patterns 08 Daily Media Consumption Dynamics 09 Brand Loyalty & Subscription Tenure 10 User Content Dynamics 13 Content Distribution 17 User Pricing Dynamics 19 Insights Into The Future of OTT Services 21 Future of OTT Streaming: 2023 and Beyond 23 2
US OTT (SVOD) - The New Frontier EXECUTIVE SUMMARY The US OTT market has grown exponentially in recent years, driven by the increasing availability of high-speed internet and the proliferation of smartphones. However, the market is showing signs of saturation, leading to a shift in dynamics in which OTT giants are implementing various strategies to battle churn due to intense competition and shift in consumer preferences. One of the key challenges facing OTT platforms is the increasing fragmentation of the market. With a growing number of smaller players entering the market, it is becoming more difficult for OTT platforms to stand out. This is why OTT service providers need to understand the newer engagement touchpoints, content strategies, pricing preferences, and brand loyalty indicators. By understanding these factors, SVOD platforms can re-engineer their go-to-market (GTM) and growth strategies to remain competitive in the years to come. SGA conducted a survey of over 1000 viewers of digital streaming content across the US to assess the changing subscriber preference and perception within the US OTT services segment. The results highlighted key findings: 1. The survey reported a significant shift in media consumption behaviours, with notable emphasis on extended viewing patterns. A large portion of respondents, over 80%, are spending at least 1 hr every day viewing OTT video streaming services. 2. A noticeable spike in subscription patterns emerged in 2023, particularly among respondents who have subscribed to multiple of 5, 6, and 7 OTT platforms. 3. Main reasons for respondents being hooked to the current OTT subscription is due to breadth of the content library; premium quality of experience; and flexibility to access content on the go. 4. Netflix and Amazon Prime Video recorded the highest share of respondents for ‘10+ years of subscription tenure. 5. Approximately 70% of the survey participants subscribing to OTT platforms fall within the 1 to 4-year tenure category, indicating a growing preference for recently introduced OTT platforms including Disney+, Max, Paramount+, and Peacock. 6. TV Shows were the favourite content type of most respondents and usually preferred by the older respondents. 7. The viewership of Romance and Drama genres has declined across all OTT platforms in 2023, compared to the previous year. 8. Majority of respondents currently subscribed to Hulu and Netflix considered their pricing to be in the premium range compared to other OTT subscriptions. 9. A significant portion of respondents have no plans to increase their spending on OTT or SVOD services over the next 12-18 months. 10. More than one-third of respondents said they would like their current OTT service providers to invest more in premium content libraries. n = 1000 (August 2023) Source: SG Analytics OTT Services Consumer Survey in the US 3
US OTT (SVOD) - The New Frontier The US Over the Top (OTT) market has witnessed a significant transformation driven by shifts in consumer behavior and subscription patterns. The key factors contributing to these shifts are changing consumer preferences and the sheer number of subscription options available. Brand Perception Study Leading OTT players are aggressively competing to expand their subscriber base by offering unique content that appeals to the target audience. These video streaming providers, especially in the SVOD market segment, are investing in original content and testing hybrid monetization approaches to draw in customers, drive revenues, and improve brand attractiveness. Brand Share by Respondents HBO Max 37% Paramount+ 32% Netflix 72% Hulu 51% ESPN+ 17% YouTube TV 13% Peacock (NBCUniversal) 31% Discovery+ 12% Tubi 11% Sling TV 4% Showtime 7% Vudu 4% BriBox 2% Philo 2% Amazon Prime Video 71% Disney+ 47% Apple TV+ 19% Others 10% STARZ 6% 4
US OTT (SVOD) - The New Frontier Netflix a pioneer of the SVOD media distribution model, is the most popular platform, with 72% of the respondents subscribing to its streaming service. Although Netflix holds the first-mover advantage, the platform has witnessed a declining user base, with research indicating a trend of subscriber loss since early 2022. If this ongoing trend of subscription cancellations persists, Netflix is likely to relinquish its dominant position to Amazon Prime Video and Disney+ soon. Amazon Prime Video is the second most popular OTT platform, with 71% of respondents competing neck- to-neck with the leading streaming platform. Amazon Prime Video, launched as an additional benefit (at no extra cost) to subscribers of Amazon Prime express shipping services, proved to be a game changer for the ecommerce giant. which helped amass over 200 million subscribers globally. Hulu is the third most popular OTT platform, with 51% of respondents opting for its video streaming service. Hulu, which experimented with a hybrid advertising/ subscription model, was an instant success, with the majority of viewers willing to opt for the low-cost option that includes ads. With Hulu’s hybrid monetization approach generating over $3bn in advertising revenues, Netflix and Disney+ followed suit by launching their low- cost ad-supported tiers. Disney+ is the fourth most popular platform, with 47% of the respondents subscribing to its service. Disney, which acquired a controlling stake in BAMTech, took advantage of technologies being built for ESPN+ to launch its streaming service, Disney+. Although Disney+ was a late entrant into the streaming market, its content library was well-received by customers, which enabled it to amass over 150 million subscribers in a short period. Max is the fifth most popular platform, with 37% of respondent subscriptions. The merger of WarnerMedia and Discovery, Inc. in 2022 resulted in the creation of Warner Bros. Discovery (WBD). WBD’s initial plan was to merge HBO Max and Discovery+ in 2023, but the company chose to retain Discovery+ and went ahead with rebranding HBO Max as ‘Max’. This move was part of the company’s strategy to signal a broader program mix by adding more Discovery content and to appeal as a more family-friendly platform, targeting households with children. Paramount+ is the sixth most popular streaming service, with 32% of respondents choosing the platform. Paramount+ was launched in March 2021 as a rebranded version of CBS All Access. The service has rapidly grown since its rebranding, reaching over 30 million subscribers in the US. Paramount+ offers a wide variety of content, including popular movies and TV shows from the Paramount library. 5
US OTT (SVOD) - The New Frontier OTT Platform by Age 30% 20% 10% 0% 20–29 years 30–39 years 40–49 years 50–69 years 70+ years Netflix Prime Video Hulu Disney+ Max Paramount+ • Netflix and Amazon Prime Video were noted as the most popular OTT platforms across all age groups. • Disney+ emerged as the third most popular platform among respondents belonging to the 40–49 age group, overtaking Hulu. • Respondents aged 50 years and above displayed a strong inclination toward Amazon Prime Video. OTT Platform by Gender 80% 60% 34% 33% 40% 25% 22% 16% 16% 20% 38% 38% 26% 25% 21% 17% 0% Netflix Prime Video Hulu Disney+ Max Paramount+ Male Female • Male respondents outnumbered female respondents across all platforms. Among the male respondents, the highest viewership was on Netflix (38%) and Amazon Prime (38%), followed by Hulu (26%), Disney+ (25%), Max (21%), and Paramount+ (17%). • Female respondents lagged slightly behind their male counterparts across all platforms. Netflix (34%) had the highest number of female viewers, followed by Amazon Prime (33%), Hulu (25%), Disney+ (22%), Max (16%), and Paramount+ (16%) 6
US OTT (SVOD) - The New Frontier Emerging OTT Platforms: Peacock, which was launched in mid-2020, emerged as the seventh most popular platform, with 31% of respondents share. Owned and operated by NBCUniversal, Peacock has a strong focus on original content and also offers a mix of live and on-demand programs. It features content from studios like Nickelodeon, Showtime, The History Channel, ABC, and CBS. Peacock stands out as a compelling choice for sports fans as it offers live coverage of a variety of sports, including the EPL, NFL, and MLB. Peacock has adopted a tiered pricing strategy, offering a free tier with limited content as well as paid tiers that offer more features and content. Also, the paid tiers are relatively affordable, making Peacock a more accessible option for a broader demographic. The platform was able to amass more than 22 million paid subscribers in a relatively brief timeframe. Discovery+, launched in January 2021, quickly gained traction and established itself as a popular streaming platform, attracting a 12% share of respondents. Discovery+ has swiftly garnered a following thanks to its competitive pricing and strong content library, particularly its emphasis on non-fictional content and specialized documentaries. While Discovery+ is still a relatively small player, its subscriber base is expanding at a rapid pace, growing from 15 million in 2021 to 24 million subscribers by the end of the first quarter of 2022. 7
US OTT (SVOD) - The New Frontier Changing Subscription Patterns Viewers are seeking convenience, content library, and premium quality, which most OTT platforms offer. This demand has led to a surge in the adoption of multiple streaming services, reshaping the media and entertainment industry. OTT Subscriptions 15% 180 160 11% 140 120 100 59% 80 60 40 20 0 5 Subscriptions 6 Subscriptions 7 Subscriptions 2022 2023 The overall survey sample reported a noticeable spike in subscription patterns during 2023, specifically where respondents have subscribed to 5, 6, and 7 OTT platforms. It demonstrates an uptick of 15%, 11%, and a significant 59%, respectively. OTT Subscriptions 250 11% 13% 200 150 100 50 0 2 Subscriptions 3 Subscriptions 2022 2023 • There was a visible decline in the number of respondents who subscribed to 2 and 3 platforms in 2023, with a drop of 11% and 13%, respectively, from the previous year. The survey sample clearly indicates that respondents who earlier had less than 4 subscriptions are hopping between platforms and opting for additional streaming services to access their preferred choice of content and genres. 8
US OTT (SVOD) - The New Frontier The study demonstrates a rise in daily media consumption rates, as the majority of users are investing more than two hours every day on OTT video streaming services. Daily Media Consumption Dynamics 35% 30% 25% 20% 15% 10% 5% 0% Less than 10 minutes 11-60 minutes 61-120 minutes 121-180 minutes 181-240 minutes Beyond 241 minutes Year 2022 Year 2023 The survey reported a significant shift in media consumption behaviors, with a notable emphasis on extended viewing patterns. Over 80% of respondents are spending at least an hour every day viewing OTT video streaming services. Males (46%) spend more than an hour per day streaming OTT content than females (37%) do. The data indicates that a significant percentage (28%) of respondents remain consistent in their preference for consuming mid-length OTT sessions (61 and 120 minutes). Respondents in this duration category marginally declined by 2% in 2023, compared to 2022. Over 55% of respondents are spending two hours or more on OTT platforms, signaling a growing trend toward longer-duration viewing sessions. During 2022 and 2023, a mere 3% of respondents were involved in extremely short OTT sessions that lasted less than 10 minutes. This underlines the user attitude of not being drawn toward short-form video content (of disinterest in short-form video content). The survey data suggests a shift in OTT screen-watching time duration between 2022 and 2023: • A decrease in moderate duration sessions (11 to 60 minutes) - There was a slight decline in respondents viewing OTT content for moderate lengths of 11–60 minutes, which fell from 19% in 2022 to 14% in 2023. • An increase in longer duration sessions (121 to 240 minutes) - There is a notable increase in respondents who reported watching content for 121 to 180 minutes, which rose from 22% in 2022 to 25% in 2023. This suggests a growing trend toward longer-duration viewing sessions. - The percentage of respondents engaged in OTT sessions lasting 181 to 240 minutes increased from 11% in 2022 to 14% in 2023. This indicates a growing segment of viewers willing to invest more time in OTT content. • A growing trend toward extended duration sessions (241 minutes and beyond) - Respondents who reported watching OTT content beyond 241 minutes also increased from 14% in 2022 to 16% in 2023. This indicates a gradual uptick in very long-duration viewing sessions. The survey data demonstrates a rise in daily media consumption rates, as the majority of users are investing more than two hours every day on OTT video streaming services. 9
US OTT (SVOD) - The New Frontier “ across all the surveyed OTT platforms than women (46%).“ The study emphasizes that a majority of respondents (64%) aged between 30 and 49 years consume media content on a daily basis. Overall, men (54%) reportedly spent more time streaming content Brand Loyalty & Subscription Tenure Factors Breadth of content libraty Premium qulity of experience Access on any device, anywhere and everywhere Negligible price increase Easy and flexible payment options Streanlined search and discovery Tailored pricing mondel Utra-low latency Storng live (mainly sports) catalog Hyper personal content recomendations Vast third-party aggregation services Other (please specify) 10
US OTT (SVOD) - The New Frontier A significant portion of respondents exhibited deep engagement and strong dedication to OTT platforms due to the subsequent factors: • The main reason for respondents being hooked on the current OTT subscription is because of the breadth of the content library (56%). Customers want to have a variety of content to choose from, including movies, TV shows, documentaries, and original programs. They also want the content to be unique and not something available on other platforms. • The premium quality of experience (54%) has also influenced the majority of the results as users emphasize a seamless and high-quality viewing experience. Users also place a high value on a premium-quality viewing experience. This includes factors such as high- definition video, smooth streaming without buffering, a user-friendly interface, and excellent audio quality. • The flexibility to access content anywhere, anytime, on various devices (35%), regardless of location, is a key factor in retaining users. Being able to watch their preferred shows and movies on various devices, whether at home or on the go, adds convenience and adaptability to users’ viewing habits. • The survey found that 25% of the respondents are willing to accept a negligible price increase, while 23% prefer easy and flexible payment options. Subscribers are willing to tolerate slight price increases if other factors align with their preferences. Given that the cost of OTT subscriptions plays a major role in customers’ decision- making process, OTT platforms need to be mindful when formulating their pricing strategies. The concept of the Overall Experience can be grasped by integrating all the elements described above. Ultimately, what matters to customers, especially millennials and Gen X, is that the OTT platform they subscribe to offers a diverse selection of exclusive content, the flexibility to enjoy their favorite content on the move, affordability, and top-notch audio and video quality. OTT platforms should prioritize delivering a comprehensive package encompassing all these attributes to establish a strong brand image and continue to stay competitive. OTT Subscription Tenure Subscription Tenure 80% 70% 60% 50% 40% 30% 20% 10% 0% Netflix Prime Video Hulu Disney+ Max Paramount+ Peacock Apple TV+ ESPN+ YouTube TV Discovery+ Tubi Showtime STARZ Sling TV Vudu Others Less than 1 year 1-2 years 2-4 years 4-6 years 6-8 years 8-10 years 10+ years The subscription tenure period refers to the duration for which a respondent subscribes to a particular OTT platform. It is an important metric for OTT service providers to track customer retention and identify trends in customer behavior. Subscription Tenure of 10+ Years: Netflix and Amazon Prime Video had the highest share of respondents with 15% and 9%, respectively. Both platforms have established a loyal subscriber base due to their long-standing presence and offer an array of content that appeals to a diverse audience. Subscription Tenure Between 8 and 10 Years: Amazon Prime Video (7%) had the highest respondent share, surpassing Netflix (6%). The strong brand loyalty of respondents to Amazon Prime Video can be linked to its extensive content library, competitive pricing, and bundled services, all of which have broad appeal to a diverse audience. Subscription Tenure Between 6 and 8 Years: Netflix was ahead of Amazon Prime Video at 12% and 10%, respectively. Subscription Tenure Between 4 and 6 Years: Amazon Prime Video was ahead of Netflix again, at 17% and 15%, respectively. Hulu has also captured a significant share of respondents (11%) for this tenure period. Hulu’s focus on original content, as well as its family friendly programs and affordable pricing, has helped the streaming service attract more subscribers. 11
US OTT (SVOD) - The New Frontier Subscription Tenure Between 2 and 4 Years: Newly launched platforms, Disney+ (31%) and MAX (23%) had the highest number of respondents, surpassing Hulu (17%), Amazon Prime Video (17%), and Netflix (15%). The growing popularity of Disney+ can be credited to its diverse content offerings tailored for children and families. According to SGA’s research, Disney+ has a comparatively low churn rate owing to its varied content targeting a wider audience. Additionally, for this tenure period, Hulu has overtaken Netflix, thanks to its affordable pricing and Live TV service, allowing users to live stream over 50 broadcast and cable-originated programs. Subscription tenure between 1 and 2 years: This tenure period witnessed many new OTT platforms being launched, including Disney+ (13%), Peacock (12%), Paramount+ (11%), and Max (11%). These recently launched OTT platforms have managed to reach a broader audience appeal by combining diverse content libraries, competitive pricing, user-friendly interfaces, and effective marketing strategies. Subscriptions for Netflix, Amazon, and Hulu declined over the years owing to emerging platforms that are meeting customer needs. Subscription Tenure of Less Than 1 Year: This tenure period witnessed the growing popularity of Paramount+ (10%) and Peacock (7%) among survey respondents. These platforms’ low-cost plans were able to attract new subscribers, making them more accessible to a wider range of people. The competition among OTT platforms is likely to drive innovation, leading to more unique content offerings, user-friendly features, and competitive pricing models. This will ultimately benefit consumers with a wider range of choices and enhanced entertainment experiences. of the survey respondents fall within the 1 to 4 years subscription tenure category, indicating a growing preference for recently launched OTT platforms. 12
US OTT (SVOD) - The New Frontier This comprehensive of respondents’ preferences for the most popular genres and their preferred OTT platforms. report provides overview viewing a User Content Dynamics TV Shows Films Original 88% 73% 59% Documentaries Sport 52% 43% Top 5 Content Preferences by Respondents: According to the survey, the top five content preferences for OTT platforms included documentaries, original programs, and sports. Together, these five content categories accounted for a 78% share of survey responses. The majority of respondents for the top five content categories were from the age group of 30-49 years. • TV Shows are the preferred content type for most respondents and usually preferred by the older respondents as they are longer and offer a sense of continuity and character. • Films are the second most preferred content type with 73% of respondents as they offer a concentrated viewing experience. • Original content is the third most popular content type and is preferred by adults of both genders as the content is exclusive and its availability makes it more valuable. Streaming platforms invest heavily in creating original programs to set themselves apart. These original shows and movies not only attract subscribers but also help build brand loyalty. • Documentaries are growing popular among the respondents as they provide a unique perspective and can be educational and entertaining. This content category saw an evenly balanced distribution among male (51%) and female (49%) respondents. • Sports content is particularly preferred by male respondents (69%). The variety of sports and live sports is garnering a lot of attention and has shown growing popularity. • Other popular content preferences by respondents include music videos (17%), news videos (26%), concerts (13%), user-generated videos (14%), and short-form clips (20%). TV shows, movies, 13
US OTT (SVOD) - The New Frontier Top 5 Genres of Content Customers Like to Watch: Drama Comedy Mystery 65% 64% 56% Action Thriller 54% 47% 550 400 250 100 -50 Action Adventure Animation Anthology Comedy Drama Educational Factual Family Fantasy Games Horror Infomercials Kids Music Mystery News Reality Religious Romance Sci-Fi Soap Opera Sports Suspense Thriller Variety Westerns Others Netflix Peacock (NBCUniversal) Amazon Prime Video Hulu ESPN+ Disney+ YouTube TV HBO Max Discovery+ Paramount+ Tubi Apple TV+ The graph above provides a comprehensive overview of respondents’ viewing preferences for the most popular genres and their preferred OTT platforms. Netflix and Amazon Prime had a similar distribution in terms of genre. However, Netflix has more respondents across all genres with Amazon Prime Video slightly outnumbering Netflix only in Westerns, News, Sci-Fi, and Factual.“ 14
US OTT (SVOD) - The New Frontier • Drama (65%) secured its position as the most popular genre, primarily due to its ability to evoke strong emotions among the audience. This genre claimed the top spot among respondents subscribed to Netflix, Amazon Prime, Hulu, and Paramount+. Also, this genre is popular in the US because of its emotionally impactful narratives that delve into unique cultural nuances and social norms. • Comedy (64%) is the second most popular choice particularly for households with children due to its distinctive ability to cross generation lines. In terms of platform, Comedy ranked as the topmost genre on Disney+, Max, Apple TV, Peacock, YouTube, and Tubi. • Mystery (56%) is the third most popular genre on all the major platforms including Netflix, Amazon Prime, Hulu, Disney+, HBO Max, and Paramount+. • Action (54%) is the fourth most popular genre on major platforms such as Netflix, Amazon Prime, Hulu, Disney+, and Max. This genre is gaining popularity as many OTT platforms are constantly expanding their content libraries by acquiring streaming rights of international action films. The crossover appeal of action gaming and action cinema has further boosted the genre’s popularity. • Thriller (47%) is the fifth most popular genre on major platforms, including Netflix, Amazon Prime, Hulu, Disney+, and Max. The viewership of genres such as Comedy, Action, Mystery, Thriller, Sci-Fi, and Adventure has increased across all OTT platforms in 2023 as compared to 2022. The viewership of Romance and Drama genres has declined across all OTT platforms in 2023, compared to the previous year. Family genre (32%) is gaining more popularity as it focuses on content related to children and family. Other genres with increasing viewership are Sports, News, Westerns, Games, Factual, and Anthology. 15
US OTT (SVOD) - The New Frontier Change in viewing patterns OR customer preferences: 2023 compared to 2022 Changing viewing patterns or customer preferences can result in fluctuation in the availability of certain genres. By understanding these trends, streaming services can continue to provide engaging content and keep audiences coming back for more. Netflix saw a decline in viewership for Romance and Drama, but a slight increase for Mystery, Action, and Thriller. Other genres that saw an increase in viewership were Anthology, Infomercials, Games, Westerns, and Factual. Amazon Prime Video saw a decline in viewership for Romance and Drama, but a slight increase for Comedy and Action. Mystery saw the biggest increase in viewership. Hulu saw a decline in viewership for Romance, but a slight increase for News and Adventure. Western and Games saw the biggest increase in viewership. Disney+ saw a decline in viewership for Romance and Drama, but a significant increase for Animation, Kids, Family, Adventure, and Westerns. Comedy, Sports, and Anthology saw the biggest increase in viewership. Max saw a decline in viewership for Drama and Romance, but a slight increase for Comedy, Action, and Mystery. Games, Western, Family, Adventure, Fantasy, and Sci-Fi saw the biggest increase in viewership. Paramount+ saw a slight decline in viewership for Drama and romance, but a slight increase for Comedy, Mystery, Action, Thriller, Sci-Fi, and Adventure. Western, Anthology, and Music saw the biggest increase in viewership. Peacock saw a big increase in viewership for Sci-Fi and Adventure, but a slight decrease for Drama. Family and Sports saw the biggest increase in viewership. Apple TV saw an increase in viewership for Comedy, Mystery, Action, and Thriller, but a decrease for Drama, Romance, and Reality. Western, Factual, Music, Suspense, and Adventure saw the biggest increase in viewership. YouTube TV saw an increase in viewership for Comedy, Action, Mystery, and Sports, but a decrease for Drama. Western, Music, Family, and Games saw the biggest increase in viewership. Tubi saw a slight decline in viewership for Educational, Sci-Fi, Romance, and Animation, but a slight increase for Comedy, Drama, Mystery, Fantasy, Games, News, and Suspense. 16
US OTT (SVOD) - The New Frontier Content Distribution Preferred Access Points 2023 0% 10% 20% Connected TV 30% 40% Smartphone 50% 60% 70% 80% 90% 100% PC Tablet Respondents Share by Prominent Access Points: In terms of prominent access points, connected TVs (43%) had the highest share of respondents, followed by Smartphones (22%), PCs (20%), and Tablets (19%). In comparison to 2022, there was a marginal decline in access points like TVs (-2%) and Smartphones (-1%), but users of PCs remained unaffected, while there was an increase in the usage of Tablets (2%). • Connected TV was the most preferred medium for watching TV shows, films, originals, sports, etc., as it can be collectively viewed with family or friends. • The most preferred content categories among all devices were TV shows (43%), short forms (32%), films (31%), user-generated videos (26%), and news (25%). • Concerts were the least watched content category across all access points. Content by Prominent Access Points Concerts Documentaries Music Videos Sports Originals News Videos User-generated Videos Film Short form TV Shows 0% 20% 40% 60% 80% 100% 120% 140% 160% 180% 200% Connected TV Smartphone PC Tablet 17
US OTT (SVOD) - The New Frontier Content Repositories by Prominent Access Points: Connected TV: The content categories that received the highest viewership when accessed via connected TV were TV shows (87%), films (68%), originals (54%), documentaries (49%), and sports (46%). Compared to 2022, connected TV witnessed an uptick of 15% in user- generated videos, whereas music videos and original content declined by 14% and 11%, respectively. PC’s: Subscribers accessing media through PC’s mostly watched short forms (32%), followed by TV shows (30%), user-generated videos (24%), films (22 %), and news videos (21%). Smartphone: While accessing streaming media via smartphones, respondents mostly viewed short forms (39%), user-generated videos (32%), and TV shows (28%). Tablets: Respondents accessing media via tablets mostly watched short forms content (38%), followed by TV shows (29%), and user-generated videos (28%). Preferred Content Resolution and Available Options: Preferred Content Resolution 0% 10% 20% 30% SD 40% 50% 60% 70% 80% 16K 8K UHD 4K 1080p HD Preference by Availability: • High Definition (HD) resolution was the most popular choice among respondents (68%) due to its widespread availability. HD is a standardized format that ensures seamless compatibility and consistent viewing quality. With the standard 16:9 aspect ratio, the HD format strikes a fine balance between enhanced image quality and optimal data bandwidth usage. • Based on availability, 1080p resolution was the second choice of preference (54%) for viewing OTT content. The abundance of 1080p content, compatibility with most modern devices, and modest bandwidth usage contribute to its popularity. • 4K resolution is the third most preferred resolution for over one-fifth of respondents (21%). With the advent of compatible future-proof TVs and smartphones, 4K resolution is poised to become even more mainstream, as viewers increasingly demand a superior visual experience. Ranking by Preference: Ranking by Preference Rank 1: HD resolution (37%) 4%3%2% 6% 37% Rank 2: 4K resolution (28%) 20% Rank 3: 1080p resolution (20%) 28% HD 4K 1080p UHD SD 6K-8K 7K-16K 18
US OTT (SVOD) - The New Frontier Consumers are increasingly seeking sustainable and cost-effective pricing, leading them to prefer budget-friendly OTT services despite being offered less content and features compared to premium platforms. User Pricing Dynamics Subscriber Pricing Perception: Pricing Perception 15% 23% 30% 32% Paramount+ 8% 46% 27% 19% Max 11% 30% 29% 30% Disney+ 16% 19% 33% 32% Hulu 12% 28% 26% 34% Amazon Prime Video 13% 33% 26% 28% Netflix 0% 20% 40% 60% 80% 100% Economical Value Competitive Premium • The majority of respondents who are subscribed to Max (46%) and Netflix (33%) considered their pricing to be in the premium range when compared to other OTT subscriptions. • Subscribers of Amazon Prime Video (34%), Hulu (33%), and Paramount+ (32%), viewed their subscription pricing as offering good value for the money. • Only a small percentage of Hulu and Paramount+ subscribers (16% and 15%, respectively) perceived that their subscription pricing was budget-friendly in comparison to other platforms. Peacock, which has adopted a tiered pricing strategy, is also considered by most respondents to be economical. • Over a quarter of respondents (26% to 32%) subscribed to their respective OTT platforms deemed the pricing to be highly competitive in comparison to their other existing subscriptions with similar content consumption value. 19
US OTT (SVOD) - The New Frontier When analyzing the overall survey sample, it’s crucial to acknowledge that the majority of respondents view Netflix as being too expensive. Some viewers, especially those with a higher disposable income, are more inclined to subscribe to Netflix at its premium price due to its extensive content library. Nonetheless, a fifth (19.4%) of the total respondents considering Netflix overpriced “ suggest that a significant portion of consumers are seeking more sustainable and cost-effective pricing. As a result of economic factors like inflation and increasing interest rates, consumers are becoming increasingly price-conscious, making them more susceptible to opt for a more budget-friendly OTT service, even if it offers less content and features compared to Netflix. low-cost, ad-supported subscription plans.“ OTT service providers are addressing the increase in price sensitivity by introducing more affordable pricing options, with most platforms now offering 20
US OTT (SVOD) - The New Frontier The US OTT market is highly dynamic and evolving rapidly due to increasing competition and changing customer preferences. OTT service providers can successfully navigate this complex landscape by understanding the ever-changing needs and preferences of their customers. Insights Into the Future of OTT Services Preferred Global or Regional OTT Platforms Which Global or Local OTT Platform are You Willing to Subscribe to, if They Enter the US Market? 0% 10% 20% 30% 40% 50% 60% Rakuten TV 70% 80% 90% 100% Don’t know any of these brands BBC iPlayer SonyLIV When asked about which global or local OTT platform the respondents would be willing to subscribe to if they entered the US market within the next 12-18 months: • A significant portion of respondents (68%) were not familiar with other global or regional OTT platforms that are popular outside of the US. • BBC iPlayer (12%) stands out as the top preference among global or regional OTT platforms. The BBC iPlayer was initially designed as a ‘catch-up’ service, offering programs online for a limited time after broadcast. The BBC has broadened its reach by releasing more of its recurring series as ‘box sets’, leading to a rise in the total program hours offered on the BBC iPlayer. While BBC iPlayer is currently limited to UK residents, the BBC is looking into easing its iPlayer restrictions and extending access to viewers across Europe. • Rakuten TV (9%) was the second most preferred global OTT platform. It offers a variety of subscription plans, as well as pay-per-view and free options. Rakuten TV is available in over 40 countries across Europe. In addition to its on-demand content, Rakuten TV also offers a live TV service with over 100 channels. While it may not have the extensive library or original content of some competitors, Rakuten TV is a good option for cord-cutters and other viewers who are looking for a more affordable alternative to other video on demand (VOD) services. • A small percentage of respondents (6%) expressed willingness to subscribe to SonyLIV. It is a popular Indian OTT streaming platform owned and operated by Sony Pictures Networks India. SonyLIV is integrated with Sony Network channels and follows a freemium model, providing a combination of free and premium content. SonyLIV is likely a preferred option among individuals of Indian descent living in the US. SonyLIV is available in the US only via Sling TV. Eventually, the adoption of a global or regional OTT platform depends on factors such as content relevance, diversity, pricing, and the platform’s ability to resonate with the target audience. 21
US OTT (SVOD) - The New Frontier Anticipated Annual Spend: Viewer’s Sentiment Estimated Annual OTT Spend in the Next 12-18 Months It will increase by 6-10% from current It will increase by 1-5% from current It will remain the same 0% 10% 20% 30% 40% 50% 60% The study reveals that a significant portion of respondents (52%) have no plans to increase their spending on OTT or SVOD services over the next 12-18 months and intend to stick to their current subscription plan. In contrast, 22% of respondents are open to a slight increase in their spending, estimating it to be within the range of 1-5% higher than their present plan. Additionally, about 13% of respondents expressed an inclination to increase their spending moderately, falling within the range of 6-10% more than their current plan. The decision not to spend or to increase spending on OTT subscriptions can be influenced by a combination of economic factors, subscription fatigue, content preferences, time constraints, budget limitations, and shifting viewing habits. Significant Enhancements Subscribers Would Like Their Current OTT TV & Video Services (SVOD) to Offer in the Coming 12-18 Months Partnerships with third-party OTT apps More of 4K/8K/16K content Provide more flexible pricing models Invest in premium content libraries 0% 5% 10% 15% 20% 25% 30% 35% 40% 45% Significant enhancements that subscribers would like their current OTT service providers to offer in the coming 12–18 months include: • A considerable portion of respondents (39%) appeal to their current OTT service providers to make substantial investments in enriching their content libraries with premium content. This request underscores the importance of premium content suggesting a desire for a diverse, high-quality, and extensive array of content across various genres. • Likewise, a similar percentage of respondents (39%) are advocating for a more adaptable and flexible pricing structure. They seek options like ad-tiered subscriptions or TVOD (Transactional Video on Demand), indicating a desire for personalized pricing choices to align with individual preferences and financial considerations. • A quarter of the respondents (25%) expressed a need for elevated video quality with higher video resolutions such as 4K, 8K, or even 16K, signaling a desire for improved and more immersive viewing experience. • Approximately one-fifth of the respondents (19%) stressed the importance of forging more collaborative partnerships with third-party OTT apps. This implies demand for a more extensive content ecosystem achieved through partnerships, enhancing the overall entertainment options. These findings offer valuable insights for OTT platforms regarding viewer perception. OTT service providers should focus on enhancing premium content volume and variety, adopt flexible pricing strategies, improve video resolutions, and enter strategic partnerships with various external platforms to meet the evolving expectations of their current viewers. 22
US OTT (SVOD) - The New Frontier FUTURE OF OTT STREAMING 2023 and Beyond The US OTT market is highly dynamic and evolving rapidly due to increasing competition and changing customer preferences. OTT service providers can successfully navigate this complex landscape by understanding the ever-changing needs and preferences of their customers. OTT platforms need to focus on providing a high-quality experience that meets the needs of their target audience. This entails making investments in premium content libraries, embracing adaptable pricing strategies, enhancing streaming quality, and forming strategic alliances with external platforms to provide unique and live content. The increasing availability and affordability of 4K devices have resulted in a growing demand among subscribers for higher-resolution content. OTT platforms must prioritize expanding their 4K content libraries, capitalizing on the growing availability of higher bandwidth, and the advent of 5G technology. Most paying viewers subscribe to 5–7 platforms on average, and this number is likely to increase with growing interest in new platforms. Despite the fragmented market and apparent saturation, SGA’s survey reveals that there is ample opportunity for growth. This is evident in the success of newly launched platforms like Disney+, HBO Max, Paramount+, and Peacock, all of which have witnessed significant subscriber growth. The growing number of price-conscious consumers are prompting OTT platforms to introduce more budget- friendly choices, such as ad-supported plans. OTT service providers can capitalize on this shift by adopting programmatic targeting and sequential messaging strategies to boost their advertising revenues. OTT platforms should focus on providing a well-rounded package that includes all these elements to build a robust brand reputation and remain competitive in the market. 23
US OTT (SVOD) - The New Frontier Disclaimer This document makes descriptive reference to trademarks that may be owned by others. The use of such trademarks herein is not an assertion of ownership of such trademarks by SG Analytics (SGA) and is not intended to represent or get commercially benefited from it or imply the existence of an association between SGA and the lawful owners of such trademarks. Information regarding third-party products, services, and organizations was obtained from publicly available sources, and SGA cannot confirm the accuracy or reliability of such sources or information. Its inclusion does not imply an endorsement by or of any third party. Copyright © 2023 SG Analytics Pvt. Ltd. www.sganalytics.com Pune | Hyderabad | Bengaluru | London | Zurich | New York | San Francisco | Amsterdam | Toronto | Wroclaw 24 GET IN TOUCH