Download
1 / 25
250 likes | 412 Views
1950. Population Dynamics. (Chapter 10). Three main methods of estimation: Cohort life table Identify individuals born at same time and keep records from birth. Static life table Record age at death of individuals. Age distribution

E N D
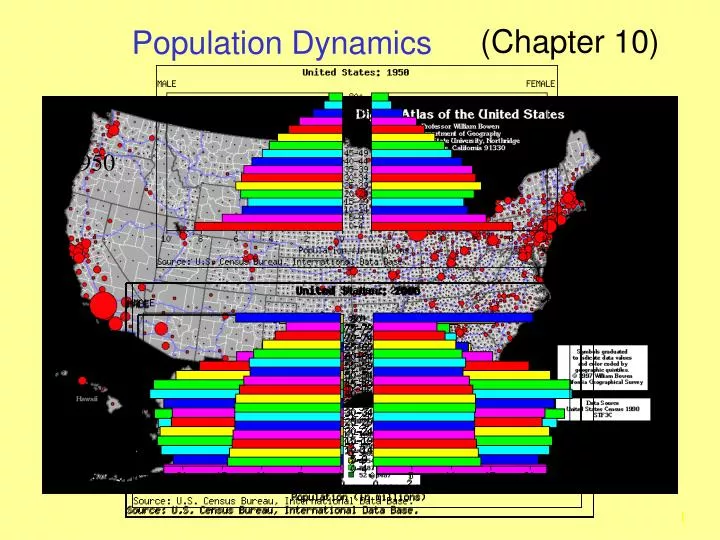
1950 Population Dynamics (Chapter 10)
Three main methods of estimation: Cohort life table Identify individuals born at same time and keep records from birth. Static life table Record age at death of individuals. Age distribution Calculate difference in proportion of individuals in each age class. Assumes differences from mortality. Estimating Patterns of Survival
Type I: Majority of mortality occurs among older individuals. Dall Sheep Type II: Constant rate of survival throughout lifetime. American Robins Type III: High mortality among young, followed by high survivorship. Sea Turtles Survivorship Curves
Age Distribution • Age distribution of a population reflects its history of survival, reproduction, and growth potential.
Age Distribution • Rio Grande Cottonwood populations (Populus deltoides wislizenii) are ….
Dynamic Population in a Variable Climate • Grant and Grant studied Galapagos Finches. • Responsiveness of population age structure to environmental variation.
Blacknose dace (Rhinichthys atratulus)South Branch Codorus Creek
700 Million Years of Eating DNA: A Conserved Competence Regulon in Gamma-Proteobacteria. Dr. Andrew Cameron Microbiology Department University of British Columbia, Vancouver, B.C. Tuesday, March 6th, at 4:30 – 5:30 p.m. Ruhl Student Center, Community Room 700 Million Years of Eating DNA: A Conserved Competence Regulon in Gamma-Proteobacteria. Dr. Andrew Cameron Microbiology Department University of British Columbia, Vancouver, B.C. Tuesday, March 6th, at 4:30 – 5:30 p.m. Ruhl Student Center, Community Room
Birth Rate: Number of young born per female; seeds per individual plant. Fecundity Schedule: Tabulation of birth rates for females of different ages. “Life Table” of survivorship per age grouping (see above) combined with fecundity schedule can be used to calculate net reproductive rates. Rates of Population Change
Phlox drummondii (phlox) Ro = Net reproductive rate; Average number of seeds produced by an individual in a population over lifetime (“birth rate”). Ro=∑ lxmx X= Age interval in days. lx = % pop. surviving to each age (x). mx= Average number seeds produced by each individual in each age category. Estimating Rates for an Annual Plant
Because P. drummondii has non-overlapping generations, we can estimate growth rate. Geometric Rate of Increase (λ): λ=N t+1 / Nt N t+1 = Size of population at future time. Nt = Size of population at some earlier time. Estimating Rates for an Annual Plant
Common Mud Turtle (K. subrubrum) About half turtles nest each year. Average generation time: T = ∑ xlxmx / Ro X= Age in years Per Capita Rate of Increase: r = ln Ro / T ln = Base natural logarithms Estimating Rates when Generations Overlap fwie.fw.vt.edu/VHS/Kinosternon_subrubrum.htm
Africanized Honeybees Honeybees (Apis melifera) evolved in Africa and Europe and have since differentiated into many locally adapted subspecies. Africanized honeybees disperse much faster than European honeybees. Within 30 years they occupied most of South America, Mexico, and all of Central America. Dispersal
Collared Doves, Streptopelia decaocto, spread from Turkey into Europe after 1900. Dispersal began suddenly. Not influenced by humans. Took place in small jumps. 45 km/yr Collared Doves
Tree species began to spread northward about 16,000 years ago following retreat of glaciers and warming climate. Evidence found in preserved pollen in lake sediments. Movement rate 100 - 400 m/yr. Rapid Changes in Response to Climate Change
Holling observed numerical responses to increased prey availability. Increased prey density led to increased density of predators. Birds moved. Dispersal in Response to Changing Food Supply


