Download
1 / 24
240 likes | 583 Views
Investment Companies. Economics 71a: Spring 2007 Mayo 17, Malkiel 8 Lecture 4.8. Goals. History Closed and open funds Performance and fees Types of funds Index funds ETF’s Hedge funds How well do funds perform?. History. First funds, March 1924 State Street Research

E N D
Investment Companies Economics 71a: Spring 2007 Mayo 17, Malkiel 8 Lecture 4.8
Goals • History • Closed and open funds • Performance and fees • Types of funds • Index funds • ETF’s • Hedge funds • How well do funds perform?
History • First funds, March 1924 • State Street Research • Massachusetts Investment Trust • Massachusetts Financial Services • now owned by Sun Life of Canada • Boston is key location • Growth • Recently phenomenal • Increase in total capital between 25-50 times since 1980 • Number of funds has also exploded • 1980 = 468 funds in U.S • 1997 = 5,765 • Today around 10,000
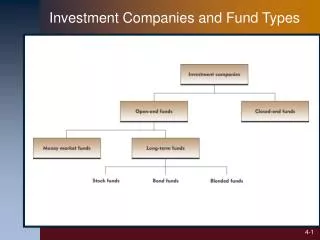
Closed versus Open Funds • Closed end fund • Traded like regular stock (price) • Fixed number of shares • Basically a corporation whose only assets are its portfolio • Open end fund • New shares issued for each buyer • Valued at current market value of the fund portfolio • Net asset value (NAV)
Net Asset Value (NAV) • Total net worth of fund • Assets - Liabilities • Assets: Stocks, bonds • Liabilities: Borrowing • NAV/share
More on Closed versus Open • Most funds are Open-End • Closed-end funds occasional trade differently from their asset values (NAV) • P<NAV, or P>NAV
Performance (open end)(Reported numbers often exclude fees.) • NAV = Net asset value • I, CG = Income + Capital gain distributions
Performance (closed end) • P = Market price • I, CG = Income + Capital gain distributions
Costs and Fees • Loading fees (paid at start, 3-6 percent) • 12b-1 fees (sales expenses) • Continue over years • Management fees • Paid to investment advisor • Between 0.25 and 1.5% • Fund expenses (legal, admin) • Trading costs
Benefits • Diversification • Stock selection skills • Bookkeeping
Types of Funds • Stocks • Bonds • Money Market
Stock Funds • Index (see next slide) • Growth • Value • Sector • Market neutral • Green and socially responsible funds • International • Country • Emerging markets
Index Mutual Funds • Designed to match (but not beat) the market • Examples • Track S&P 500 • Country funds • Why? • Market efficiency • Cost
Other Index InstrumentsExchange Traded Funds (ETF) • Traded on regular exchanges • Can be short sold • Types • Standard and Poors Depository Receipts (SPDRS) • World Equity Benchmarks (WEBS) • Diamonds (Dow) • Qubes (NASDAQ) (QQQ)
More ETF Info (See Economist) • Growing fast • Expanding into new areas • Gold • Nanotechnology • “Ultrashort QQQ” • Goes down 2% when NASDAQ up 1% • Advantages • Easy to trade long or short indices • Disadvantages • May encourage short run trading • Liquidity for some may be low
Hedge Funds • Small numbers of large investors (> $1.5 million) • Not SEC regulated (registered) • More flexible in strategies • May hold derivatives • Short sales • Leveraged (borrowing) • Performance based fees • 2% of total assets and then • 20% of profits • (2 and 20) • Limit withdrawals
Other Managed Funds • Funds of hedge funds • Pension funds • Insurance companies • Endowments/foundations
Mutual Fund Performance • Malkiel Chapter 8 • Good data experiment • Do mutual funds out perform the rest of the market?
Mutual Funds vs.Market • 10 years ending December 31, 2001 • S&P 500: +12.94 % per year • Stock mutual funds: +10.98 % • Rankings: 70’s -> 90’s • Twentieth century growth • 1 -> 176 • Templeton growth • 2 -> 126
More on rankings • Average return in 70’s • Top 20 funds in 70’s • +19% • All funds • +10.4% • Average return in the 80’s • Top 20 funds in the 70’s • 11.1% • All funds • 11.7%
More on rankings • Average return in 80’s • Top 20 funds in 80’s • +18% • S&P • +14% • Average return in the 90’s • Top 20 funds in the 80’s • 13.7% • S&P • 14.9%
The Problem of Size and Success for Mutual Funds • As funds get bigger size gets in the way • Difficult to buy stocks • 50 stock fund • 1 billion in assets • Control <5% in each stock • Universe = 1850 • 50 stock fund • 20 billion in assets • <5% in each stock • Universe = 182 • Transaction costs and “price impact”
Gurus: Luck Versus Chance • Appear to be some people who do well consistently • Peter Lynch: Michael Jordan of mutual funds (retired ahead) • Generates consistent performance • Is he smart or lucky? • Statistically, we should see some people do well for long periods of time do to chance • “Survivorship Bias”
Summary • Mutual funds are convenient way to diversify portfolios • Index funds are a powerful tool • Performance of the industry in general is not great