Download
1 / 10
100 likes | 111 Views
https://www.irjet.net/archives/V6/i11/IRJET-V6I1115.pdf

E N D
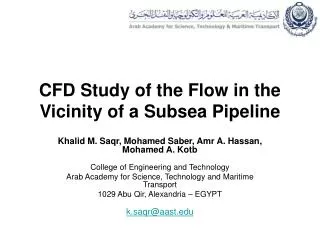
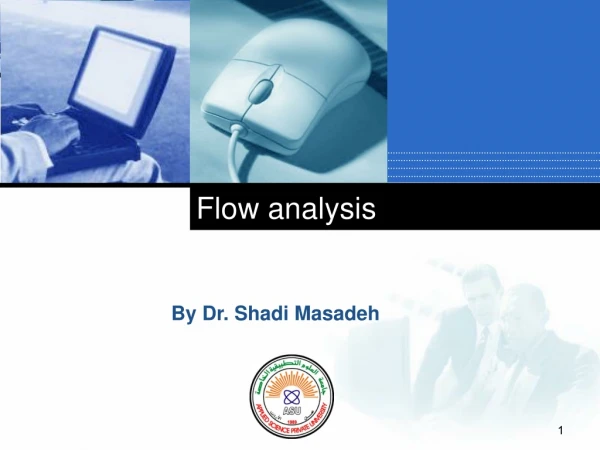
International Research Journal of Engineering and Technology(IRJET) e-ISSN: 2395-0056 Volume: 06 Issue: 11 | Nov 2019www.irjet.net p-ISSN: 2395-0072 CFD FLOW ANALYSIS OF STATION PIPELINE Harshal Singh ME 4th year, Department of Mechanical Engineering, National Institute of Technology Patna, Patna, Bihar, India ---------------------------------------------------------------------***---------------------------------------------------------------------- Abstract -Pipeline is the most cost effective, energy efficient, safe and environment friendly mode of transportation of petroleum products. They ease the overburdened Rail & Road infrastructure and minimise the environmental impacts arising out of Rail & Road transportation. Pipelines play a significant role in meeting the demand of petroleum products in India. There are seven mainline pipelines operated by HPCL. Hindustan Petroleum Corporation Limited or HPCL is an Indian oil and natural gas company with its headquarters at Mumbai, Maharashtra. HPCL operates two major refineries producing a wide variety of petroleum fuels and specialties, one in Mumbai (West Coast) of 7.5 million metric tonnes per annum or MMTPA capacity. Mumbai Pune Solapur is one of the pipelines of Mumbai refinery. The pumping of High Speed Diesel, Motoring Spirit and Sweet Kerosene Oil is done via this pipeline. The pipeline present in the refinery are called station pipeline and are separated from mainline by Station Limit Valve. The purpose of this paper is to analyse the pressure, temperature and velocity profile of fuel within the station pipeline from booster pump up to sample point. Computational Fluid Dynamics or CFD analysis is carried out for this purpose. Studying the flow under various operating conditions. The pathline followed by fuel are observed for different cases obtained by CFD analysis and their interpretations are discussed.[6] kept underground to provide an extra pressure head due to potential energy. Centrifugal type pumps have been used in MPSPL as booster pump. After booster pump the fuel is passed through basket filters to remove any foreign or unwanted substance from the fuel. Then after Sample point the fuel finally reaches main pumps. This project focuses on flow of fuel from the booster pump up to sample point. CFD analysis will be carried out for this section of the station pipeline of MPSPL. Through CFD analysis we wish to observe and interpret the pathline followed by the fluid. We will calculate and observe pressure, temperature and velocity pathline. We will also discuss about the efficiency of the booster pumps. 2. FEM METHODOLOGY AND CFD The finite element method or FEM, is a numerical method for solving problems of engineering and physics. The investigative solution of these problems generally require the solution to boundary value problems for partial differential equations. So simply it’s a numerical method for solving differential equations. The method estimates the unknown function over the domain of the given boundary conditions. To solve the problem, it subdivides a large system into smaller elements, called finite elements. The simple equations that model these finite elements are then assembled into a larger system of equations that models the entire problem. FEM then uses variational methods from the calculus of variations to approximate a solution by minimizing an associated error function. Key Words:Booster Pumps, Strainer, Sample Point, Station limit valve, Station pipeline, Pathline, Elbow joints, T Joints, SCADA, Scaled Residual & Flow rate. As it’s a numerical method, it means that it gives approximate solutions not absolute. The residual is one of the most fundamental measures of an iterative solution's convergence, as it directly quantifies the error in the solution of the system of equations. In a CFD analysis, the residual measures the local imbalance of a conserved variable in each control volume. Thus the scaled residual of all the analysis conducted is shown from figures 1 to 6.[5] 1. INTRODUCTION The Mumbai Pune Solapur Pipeline or MPSPL is operated and maintained from Mumbai Refinery, Trombay. The fuel is delivered Trombay to Pune via Vashi and Khopoli, and then on to Solapur. The fuel is pumped by Heavy duty pumps delivering flow rate of 700-775 kL/hr. These pump have a minimum suction pressure requirement which if not met causes cavitation. Simply, cavitation is the development of bubbles in liquid in areas of relatively low pressure around an impeller. The collapsing of these bubbles trigger intense shockwaves inside the pump, causing significant damage to the impeller. The fuel which comes from tanks doesn’t has enough pressure head due to various factors like frictional losses, loss due to resistive elements like 45: or 90: elbow bends, drop in level of fuel in tank etc. Thus booster pumps are added before the main pumps to provide the required pressure head. Booster pumps are Computational fluid dynamics (CFD) is a branch of fluid mechanics that uses numerical analysis to analyse and solve problems that involve fluid flows. So fluid flow analysis is essentially virtual testing and prediction of behaviour of systems which involves fluid flow. © 2019, IRJET | Impact Factor value: 7.34 | ISO 9001:2008 Certified Journal | Page 80
International Research Journal of Engineering and Technology(IRJET) e-ISSN: 2395-0056 Volume: 06 Issue: 11 | Nov 2019www.irjet.net p-ISSN: 2395-0072 Fig-1: Scaled residual of case 1 for Booster pump pump pipeline Fig-5: Scaled residual of case 3 for Booster pump pipeline Fig-2: Scaled residual of case 1 for Strainer and Sample point pipeline Fig-6: Scaled residual of case 3 for Strainer and Sampl 3. PIPELINE DETAILS AND LAYOUT The fuel from refinery tanks is delivered to booster pumps via a Manifold line, which has a diameter of 24 inch. Its then delivered to 4 booster pumps through 14- inch pipes. There is a motor operated valve or MOV of gate type. After the MOV is booster pump and then again another MOV between the common line which goes to basket filter. All of these pumps are not operated simultaneously. When a pump is not in operation the MOV between booster pump and common line is in closed position. The common line goes to basket filter. The basket filter also has one MOV before and one after it. The line then goes to sample point, from where samples are collected of the fuel. Then finally the pipe goes to the main pumps. From here pipe goes to pig release area from where it’s sent out of the refinery as mainline. Station limit valve acts as a demarcation between station pipeline and mainline. Fig-3: Scaled residual of case 2 for Booster pump pipeline We limit our study to pipeline between booster pump and sample point. First a CAD model of the pipeline was to be made for analysis. This was done in CATIA V5. The material used for pipe is API 5L X56. Its carbon steel. The diameter of pipe is 14 inch and thickness is 10mm. The rendering of the model is shown in Fig-7. Fig-4: Scaled residual of case 2 for Strainer and Sample point pipeline © 2019, IRJET | Impact Factor value: 7.34 | ISO 9001:2008 Certified Journal | Page 81
International Research Journal of Engineering and Technology(IRJET) e-ISSN: 2395-0056 Volume: 06 Issue: 11 | Nov 2019www.irjet.net p-ISSN: 2395-0072 Fig-7: Rendering of Pipeline model Fig-9: Rendering of Strainer and Sample Point Pipeline The elements like gate valve and pump weren’t incorporated directly into the CAD model but were imposed using simpler techniques. For example, when a gate valve was to be closed, the pipeline before/after closed valve (as required) removed during analysis and the section where cut was made was taken as pipe wall in the boundary condition specification. As centrifugal pumps (used here as booster pumps) deliver the output perpendicular to the direction of pipe, an inlet perpendicular to pipe at the pump location was made with the output conditions that were delivered by the actual pump. First the analysis of booster pump pipeline is done then the output (pressure and flow velocity) of the analysis is used as the input for Strainer/Basket Filter and Sample Point Pipeline. 4. BOOSTER PUMPS’ SPECIFICATIONS Table-1:Booster pumps’ specifications Pump Make Flow Rate (kL/hr) Head (meter of water column) 50 BKW Pump Efficiency (%) The analysis however had to be conducted in two parts due to the limitations of licensing in ANSYS, which was used for this computation. As the student version of ANSYS license is limited to 512,000 cells/nodes for a CFD model. Thus the model was split into two parts, one of booster pump pipeline and other with basket filter and sample point. The output of first part is used as the input of second part. [9] Booster Pump 1 B.P. & C.L. B.P. & C.L. B.P. & C.L. B.P. & C.L. 430 78.87 72.55 Booster Pump 2 800 80 206.5 79.00 Booster Pump 3 550 50 117.1 74.08 Booster Pump 4 550 50 117.1 74.08 A pump used to increase the pressure of the fluid is called booster pump. Here it’s used to prevent cavitation in main pump as discussed before. Thus the objective of booster pump is to deliver the specified pressure head to the main pump. We consider three cases (as used in MPSPL) of it, Case I: Only Booster Pump 2 in operation. Case II: Fig-8: Rendering of Booster Pump Pipeline Booster Pumps 2 & 3 simultaneously in operation. Case III: Only Booster pump 4 in operation. © 2019, IRJET | Impact Factor value: 7.34 | ISO 9001:2008 Certified Journal | Page 82
International Research Journal of Engineering and Technology(IRJET) e-ISSN: 2395-0056 Volume: 06 Issue: 11 | Nov 2019www.irjet.net p-ISSN: 2395-0072 The inlet and outlet conditions i.e. pressure head at pump inlet, pump outlet, booster pump common line and sample point outlet were taken from SCADA or Supervisory Control and Data Acquisition system in control room. SCADA gets feedback and readings from all the instruments including Pressure Transmitter. This data is used as input for the CFD analysis. Flow velocity at Booster pump 3 outlet= Q/A = 550/(π*(7*0.0254)2 x 3600) (m/s) = 1.78 m/s Gauge pressure at Booster pipeline outlet = 6.01 kgf/cm2 = 598206.00 Pa {Data taken from SCADA} The flow velocity output from the pump is calculated by using the flow rate of pump, Temperature at pump outlet for both pumps= 308 K {Data taken from SCADA} ( ) Case III: Gauge pressure at Booster pump 4 outlet = 3.50 kgf/cm2 = 343233.00 Pa {Data taken from SCADA} Thus, Flow velocity at Booster pump 4 outlet = Q/A = 550/(π*(7*0.0254)2 x 3600) (m/s) = 1.78 m/s Gauge pressure at Booster pipeline outlet = 2.59 kgf/cm2 = 254267.00 Pa {Data taken from SCADA} Here, R is the radius of pipe. The input at pump inlet in CFD analysis for each case is gauge pressure at pump discharge and flow velocity output from pump. Calculating input for each case: Temperature at pump outlet= 308 K {Data taken from SCADA} The inlet condition from manifold pipe is same for all the cases, Case I: Gauge pressure at Booster pump 2 outlet = 7.67 kgf/cm2 = 752170.10 Pa {Data taken from SCADA} Gauge pressure at Manifold pipeline outlet=0.15 kgf/cm2 = 14709.98 Pa {Data taken from SCADA} Flow velocity at Booster pump 2 outlet = Q/A The ambient temperature was taken as 300K. = 800/(π*(7*0.0254)2 x 3600) (m/s) 5. FINITE ELEMENT MODEL DEVELOPMENT = 2.37 m/s Analysis is conducted in ANSYS 19.3 Fluent student version. The MPSPL pipeline transports High Speed Diesel or HSD, Motoring Spirit or MS and Sweet Kerosene Oil or SKO. For our analysis we have taken HSD or diesel as the medium. Liquid diesel-liquid (C10H22) was Gauge pressure at Booster pipeline outlet = 6.01 kgf/cm2 = 589379.70 Pa {Data taken from SCADA} Temperature at pump outlet = 308 K {Data taken from SCADA} Table-2: Properties of Diesel Case II: chosen from the fluent database. It has following properties; Gauge pressure at Booster pump 2 outlet = 7.67 kgf/cm2 = 752170.10 Pa {Data taken from SCADA} Property Value Nature Flow velocity at Booster pump 2 outlet = Q/A Density (kg/m3) 730 Constant = 800/(π*(7*0.0254)2 x 3600) (m/s) Cp (Specific Heat) (j/kg-K) 2090 Constant = 2.37 m/s Thermal Conductivity (w/m-K) 0.149 Constant Gauge pressure at Booster pump 3 outlet = 3.50 kgf/cm2 = 343233.00 Pa {Data taken from SCADA} Viscosity (kg/m-s) 0.0024 Constant © 2019, IRJET | Impact Factor value: 7.34 | ISO 9001:2008 Certified Journal | Page 83
International Research Journal of Engineering and Technology(IRJET) e-ISSN: 2395-0056 Volume: 06 Issue: 11 | Nov 2019www.irjet.net p-ISSN: 2395-0072 The analysis is done on energy equation model and the solution method used is pressure-velocity coupling; coupled scheme is used. 100 iterations are done for each analysis. Case III: 5.1 Analysis setup Case I: Fig-11: Setup for Case III The setup for Strainer and Sample point pipeline is same for all the cases. Fig-9: Setup for Case I Case II: Fig-12: Setup of Strainer and Sample point pipeline The solver is configured to pressure based solution with velocity formulation as absolute and time as steady. Gravity effects are neglected as the gravitational potential energy is negligible as compared to pressure energy in the pipeline. In boundary condition of pipe wall shear condition is set to no slip. Reference frame of Relative to cell zone is taken for calculation. Fig-10: Setup for Case II © 2019, IRJET | Impact Factor value: 7.34 | ISO 9001:2008 Certified Journal | Page 84
International Research Journal of Engineering and Technology(IRJET) e-ISSN: 2395-0056 Volume: 06 Issue: 11 | Nov 2019www.irjet.net p-ISSN: 2395-0072 6. RESULTS The Pathline of medium obtained after CFD analysis through the pipeline are shown for each case. For each case Pressure, Temperature and Velocity pathline have been plotted. 100 steps were taken for plotting the pathline with size of 0.01m. Case I: Fig-17: Pathline covered by velocity in Booster pump pipeline for Case I Fig-13: Pathline covered by pressure in Booster pump pipeline for Case I Fig-18: Pathline covered by velocity in Strainer and Sample point pipeline for Case I Fig-14: Pathline covered by pressure in Strainer and sample point pipeline for Case I Fig-19: Pathline covered by pressure in Booster pump pipeline for Case II Fig-15: Pathline covered by temperature in Booster pump pipeline for Case I Fig-20: Pathline covered by pressure in Strainer and Sample point pipeline for Case II Fig-16: Pathline covered by temperature in Strainer and Sample point pipeline for Case I © 2019, IRJET | Impact Factor value: 7.34 | ISO 9001:2008 Certified Journal | Page 85
International Research Journal of Engineering and Technology(IRJET) e-ISSN: 2395-0056 Volume: 06 Issue: 11 | Nov 2019www.irjet.net p-ISSN: 2395-0072 Case II: Case III: Fig-25: Pathline covered by pressure in Booster pump pipeline for Case III Fig-21: Pathline covered by temperature in Booster pump pipeline for Case II Fig-26: Pathline covered by pressure in Strainer and Sample point pipeline for Case III Fig-22: Pathline covered by temperature in Strainer and Sample point Fig-23: Pathline covered by velocity in Booster pump pipeline for Case II Fig-27: Pathline covered by temperature in Booster pump pipeline for Case III Fig-24: Pathline covered by velocity in Strainer and Sample point pipeline for Case II Fig-28: Pathline covered by temperature in Strainer and Sample point pipeline for Case III © 2019, IRJET | Impact Factor value: 7.34 | ISO 9001:2008 Certified Journal | Page 86
International Research Journal of Engineering and Technology(IRJET) e-ISSN: 2395-0056 Volume: 06 Issue: 11 | Nov 2019www.irjet.net p-ISSN: 2395-0072 Fig-29: Pathline covered by velocity in Booster pump Fig-31: Elbow joint observation 1 7. INTERPRETATION OF RESULT 7.1 Observation 1: A relation between pressure and temperature variation can be observed from the analysis. The regions where temperature is higher relative to surrounding regions, the pressure is higher is too and vice-versa. This relation can be seen by observing the Fig.13 & fig.15, Fig.19 & Fig.21 and Fig. 25 & Fig.27. The same observation can’t be made in Strainer and Sample point because the temperature variation isn’t as pronounced as in Booster pump pipeline case. This can be accounted as at constant density the increase/decrease in temperature results in increase/decrease in pressure of liquid; and as mentioned above that density of diesel is taken constant for analysis.[7] Fig-32: Elbow joint observation 2 7.2 Observation 2: The second more prominent observation that can be made is of pressure pathlines at elbow joints. We can see that the pressure is higher at outer radius of elbow than at inner radius. It can be seen clearly in the following images of close up of elbows taken from various cases. Fig-33: Elbow joint observation 3 Fig-34: Elbow joint observation 4 7.3 Observation 3: Fig-30: Pathline covered by velocity in Strainer and sample point pipeline for Case III The third prominent observation that can be made is of pressure pathlines at T joints. We can see that the pressure is higher at one side of T joint than at other side. It can be seen clearly in the following images of close up of elbows taken from various cases. © 2019, IRJET | Impact Factor value: 7.34 | ISO 9001:2008 Certified Journal | Page 87
International Research Journal of Engineering and Technology(IRJET) e-ISSN: 2395-0056 Volume: 06 Issue: 11 | Nov 2019www.irjet.net p-ISSN: 2395-0072 = (3.24+2.16)/2 {Taking average from the colour map} = 2.70 m/s Thus, flow rate= Internal area of pipe cross section*Flow velocity Fig-35: T joint observation 1 = π*(7*0.0254)2*2.70 = 0.268 m3/s = 0.268*3600 kL/hr = 965.338 kL/hr Sum of rated flow rates of booster = 800+550 kL/hr pump 2 & 3 = 1350 kL/hr Fig-36: T joint observation 2 Thus, the axiom of parallel pumps’ relation for flowrate is satisfied in our model. 8. CONCLUSION The CFD analysis of Station Pipeline of MPSPL for Booster pump to Sample Point section has been done and the pathlines obtained for pressure, temperature and velocity have been shown. We drew following observations from the analysis, the temperature and pressure distribution in pipeline are related to some extent; the pressure is higher at outer radius of elbow than at inner radius; the pressure is higher at one side of T joint than at other side and axiom stating that the sum of flowrates of 2 pumps in parallel is more than the actual output is satisfied in our model. Fig-37: T joint observation 3 ACKNOWLEDGEMENT First of all, I would like to thank HPCL for providing me this opportunity to learn the workings of pipeline department of MPSPL. I thank Anil sir [DGM MPSPL], Gaurav sir [Manager Maintenance] and Ritesh sir [Operations officer] for teaching me the workings of the department and also guiding me through this project. Fig-38: T joint observation 4 7.4 Observation 4: REFERENCES In case 2 two pumps are operating in parallel. Pumps are said to be operated in parallel when two or more pumps are connected to a common discharge line, and share the same suction conditions. Two pumps in parallel deliver less than total the flow rate of both pumps in the system because of the increased friction in the piping. This can be observed in case 2.[8] Verifying it numerically, 1.https://www.hindustanpetroleum.com/product pipelines 2.https://www.engineering.com/DesignSoftware /DesignSoftwareArticles/ArticleID/9296/3- Criteria-for-Assessing-CFD-Convergence.aspx 3.https://studentcommunity.ansys.com/thread/li mitations-to-student- license/?order=all#comment-986591aa-cec4- 478e-80ed-a874014c0100 Flow velocity at Booster pump pipeline outlet © 2019, IRJET | Impact Factor value: 7.34 | ISO 9001:2008 Certified Journal | Page 88
International Research Journal of Engineering and Technology(IRJET) e-ISSN: 2395-0056 Volume: 06 Issue: 11 | Nov 2019www.irjet.net p-ISSN: 2395-0072 4.Guille(https://physics.stackexchange.com/users /76365/guille), Water pressure vs temperature, URL (version: 2018-05-21): 5.http://www.mcnallyinstitute.com/18-html/18- 1.htm 6.Introduction to finite element method by J.N. Reddy 7.A Guide to Numerical Methods for Transport Equations by Dmitri Kuzmin 8.Simulation and flow analysis through a straight pipe by Saswat Sambit 9.Abdulwahhaba Mohammed, Injetib N K, Dakhilc Sadoun Fahad “CFD Simulation and flow analysis through a T junction pipe” IJEST, 4(7),3393-3407, [2012] © 2019, IRJET | Impact Factor value: 7.34 | ISO 9001:2008 Certified Journal | Page 89