Download
1 / 10
100 likes | 113 Views
Aarkstore Enterprise announced latest Market Research Report Titled "Country Comparison Chartbook - Technology & Communications Indicators: Asia-Pacific"<br>

E N D
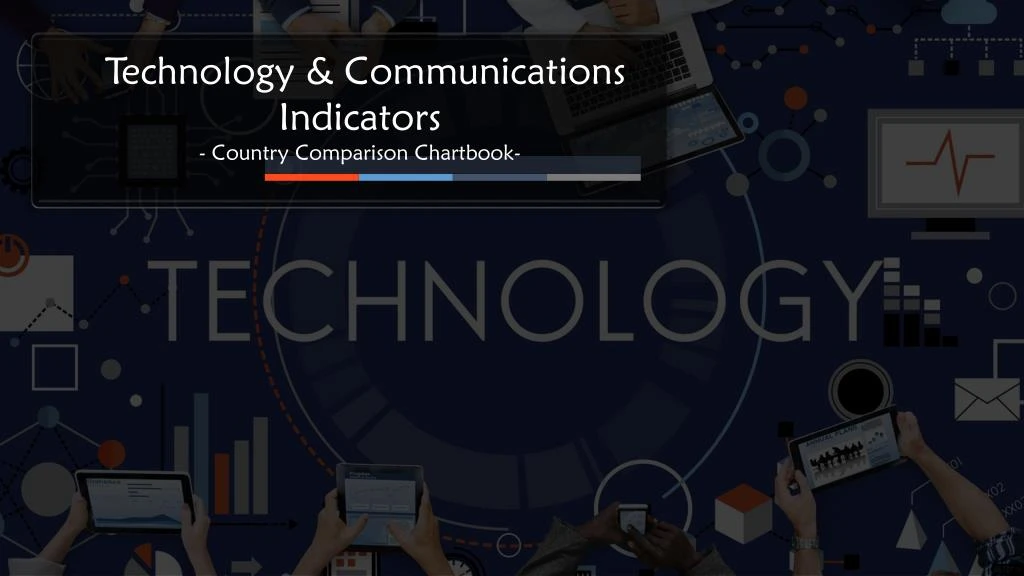
Technology & Communications Indicators - Country Comparison Chartbook-
Key highlights 2.1 million Japan has the largest telecoms workforce in the group, at approximately 2.1 million in 2017. Telecoms investment as a percentage of GDP was highest in India in 2016. 62.8% In 2017 Malaysia had the highest rate of mobile phone penetration. $ 2.6 billion during 2015 - 16
Scope 01 02 03 04 05 06 Identifies the size of the telecommunications workforce Identifies the proportion of the workforce employed in telecommunications Details investment in telecommunications over time as a percentage of GDP Identifies the penetration rates of both fixed-line and mobile telephone devices. Compares the volume of mobile phones to the volume of fixed-line telephones over time and between countries. Details smartphone penetration rates.
Summary Demand Rapid rate Technology has grown at an incredibly rapid rate over the last thirty years In the present day every aspect of the lives of the majority of the worlds population is dominated by technology and communication - for the many - is global and instananeous. Power Invention The power and capabilities of technologies incorporating the microchip have increased exponentially every year. Since the invention of the first microchip in 1959 in the US
Reasons to buy How many fixed-line telephones exist? How large is the telecoms workforce? How has the investment rate changed over time? What percentage of the workforce is made up of telecoms workers? How high is investment in telecoms as a percentage of GDP? How has this rate changed over time?
Table of Contents Introduction Mobile Penetration Telecom Employees 01 STEP 06 STEP 02 STEP 05 STEP Fixed-Line Penetration Telecom Workforce 04 STEP 03 STEP Telecom Investment
Related Reports: Country Comparison Chartbook - Key Indicators: APAC Country Comparison Chartbook - Key Indicators: Europe 01 03 02 04 Country Comparison Chartbook - Technology & Communications Indicators: Europe Country Comparison Chartbook - Technology & Communications Indicators: Europe
ABOUT AARKSTORE Aarkstore Enterprise provides businesses, start- ups, market research seekers and enthusiasts with all-inclusive yet exclusive market information encompassing a number of industry verticals. As a leading online market research report seller, Aarkstore acts as a platform for accessing statistics, forecasts, business insights, ideas, concepts and much more Our blog: https://www.aarkstore.com/blog/
BROWSE FULL MARKET REPORT Country Comparison Chartbook - Technology & Communications Indicators: Asia-Pacific RelatedMarket Research Reports – Business Services Market Research Reports
THANK YOU www.aarkstore.com