Download
1 / 5
50 likes | 59 Views
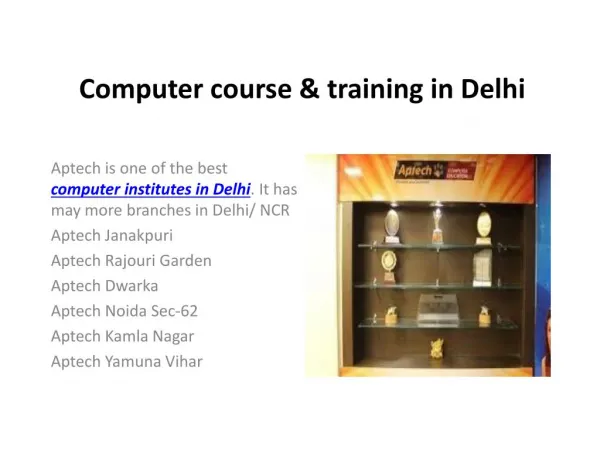
As an AI language model, I don't have real-time data, so I can't provide the most up-to-date information on specific courses in Delhi. However, I can offer some general guidance on finding a Technical Analysis course in Delhi.<br><br>

E N D
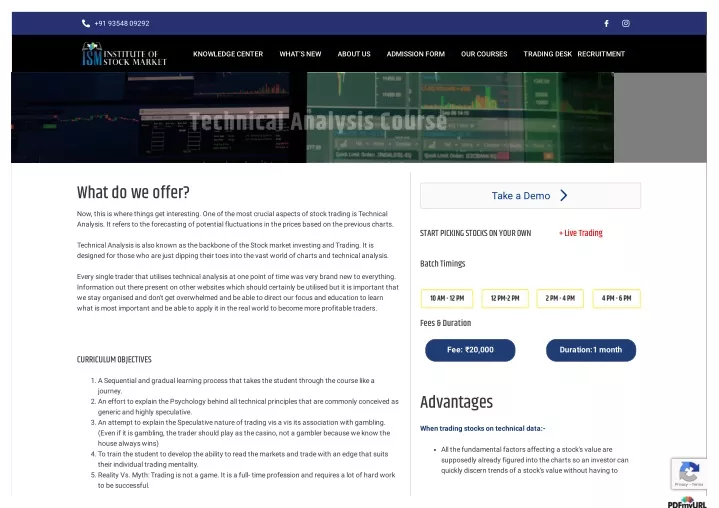
+91 93548 09292 KNOWLEDGE CENTER WHAT’S NEW ABOUT US ADMISSION FORM OUR COURSES TRADING DESK RECRUITMENT Technical Analysis Course What do we offer? Now, this is where things get interesting. One of the most crucial aspects of stock trading is Technical Analysis. It refers to the forecasting of potential fluctuations in the prices based on the previous charts. Take a Demo START PICKING STOCKS ON YOUR OWN + Live Trading Technical Analysis is also known as the backbone of the Stock market investing and Trading. It is designed for those who are just dipping their toes into the vast world of charts and technical analysis. Batch Timings Every single trader that utilises technical analysis at one point of time was very brand new to everything. Information out there present on other websites which should certainly be utilised but it is important that we stay organised and don't get overwhelmed and be able to direct our focus and education to learn what is most important and be able to apply it in the real world to become more profitable traders. Fees & Duration Fee: ₹20,000 Duration:1 month CURRICULUM OBJECTIVES 1. A Sequential and gradual learning process that takes the student through the course like a journey. 2. An effort to explain the Psychology behind all technical principles that are commonly conceived as generic and highly speculative. 3. An attempt to explain the Speculative nature of trading vis a vis its association with gambling. (Even if it is gambling, the trader should play as the casino, not a gambler because we know the house always wins) 4. To train the student to develop the ability to read the markets and trade with an edge that suits their individual trading mentality. 5. Reality Vs. Myth: Trading is not a game. It is a full- time profession and requires a lot of hard work to be successful. Advantages When trading stocks on technical data:- All the fundamental factors affecting a stock's value are supposedly already figured into the charts so an investor can quickly discern trends of a stock's value without having to Privacy - Terms
?. Completing this course would bring an end to the search for the holy grail behind trading success. research all the different types of fundamental data affecting that stock. Technical programmable mathematical algorithmic formulas:- INTRODUCTION TO TECHNICAL ANALYSIS 1. What is Technical analysis: We discuss the scope and nature of TA and how it can be used by a trader. 2. Principles of Technical Analysis. We discuss the ground principles of TA keeping Dow Theory in mind. 3. Types of Charts: Line, Bar, candlesticks and other charts that are used for TA. 4. Importance of Technical Analysis 5. Strengths and Weaknesses These can be created and utilized and give an investor the needed edge over other investors who do not use such formulas. This works fairly well for trading firms, banks, broker-dealers and in aggressive professional day trading and swing trading strategies. Such programs are especially helpful for trading medium to larger cap stocks. Identifying technical historical trading patterns:- DOW THEORY 1. Market Trends: We define a trend and how to identify it. Also discuss Primary, secondary and minor trends. 2. Market Phases: We talk about Accumulation, Participation and Distribution. 3. Dow Theory Rules: discuss the rules and explain why they need to be followed. The charts that includes trading volume and buy vs. sell trader activity allows the trader to predict a new trend, a trend reversal, and the strength of such trends. In this way, timely entry and exit points can potentially be predicted for the greatest potential profit. When basic technical data reveals potential trends that coincide with fundamentals, SUPPORT AND RESISTANCE 1. Market Structure: Identification of the markets whether they are trending or rangebound. 2. Chart Patterns: Identification with significant patterns within the market structure and how they can be interpreted by locating support and resistance zones. Double Tops and bottoms Head and Shoulders, straight and inverted Cup and Handle, straight and inverted Triangle, ascending and descending Wedge, rising and falling Flag 3. Support Equals Resistance: Explain the psychology behind S&R and why it happens. 4. Trendlines: How to draw them on the charts and what it can do for a trader. A significant double confirmation of a future trend or trend reversal for buying or selling is established. Such technical confirmations of fundamental data is highly valued by extraordinary investors for trading penny stocks for explosive profits. and more. Here's What we offer in the course CANDLESTICKS 1. Bullish Vs. Bearish: We explain how a candlestick is made. 2. Conventional Candlestick Patterns Doji bullish and bearish Hammer Hanging Man Shooting Star Spinning tops
Marubozu bullish and bearish Engulfing bullish and bearish Harami bullish and bearish Piercing bullish and bearish Dark Cloud Cover Tweezer tops and bottoms Morning and Evening Star Three white soldiers Three black crows Falling and Rising Three 3. Boring Vs. Explosive Vs. Rejection Candlesticks: Simplifying the candlestick patterns. 4. The Psychology behind: Preparing to use simplified candlestick patterns to understand price action. TECHNICAL INDICATORS AND OSCILLATORS 1. What are Indicators and Oscillators: Definition and how they can be used. 2. Scope of Indicators and Oscillators: strengths and weaknesses and correct interpretation. 3. Types of Indicators and Oscillators that will be discussed: 1. Moving Averages 2. Bollinger Bands 3. Parabolic SAR 4. VWAP 5. Fibonacci Retracements and Extensions ?. MACD 7. RSI ?. ADX 9. ATR PRICE ACTION 1. What is Price Action: We define price action and explain how it can be used for maximum profit and minimum loss. 2. Candlesticks Reengineered: Using simplified candlestick patterns to find trade entries and exits. 3. S&R Reengineered: Observing Support and resistance as demand and supply zones. 4. Timeframes: To understand the location in terms of where the trend is by toggling through multiple timeframes. Like zooming in and out of a map. RISK MANAGEMENT 1. RISK TO REWARD: How much should a trader risk for how much profit 2. Trade management: How can a trader scale their positions during a trade
TRADING PLAN 1. Read the charts to find possible opportunities. 2. Find signal on lower time frame 3. Apply entry and exit strategies 4. Finding confluence with indicators MOTIVATION AND DAILY ROUTINES 1. Trading can be stressful. It’s important for a trader to be in good mental and physical health. Meditate, exercise and eat right. 2. Patience is a virtue that all successful traders possess. 3. Success lies at the equilibrium of greed and fear. Manage your emotions. 4. Work hard to train yourself and keep upgrading. 5. Playing by emotions and luck is for the untrained. ?. Develop your skill and learn to trust your instincts. A technical analysis course is a specialized training program that focuses on the use of technical tools and techniques for analyzing financial markets, such as stocks, currencies, commodities, and more. Technical analysis involves the study of historical price and volume data to identify patterns, trends, and signals that can help traders and investors make informed trading decisions. Whether you are a beginner looking to learn the basics of technical analysis or an experienced trader seeking to enhance your skills, our technical analysis course can provide you with valuable insights and knowledge to improve your trading strategies and increase your chances of success in the financial markets. Comprehensive Curriculum: Our technical analysis course online covers a wide range of technical analysis topics, including chart patterns, technical indicators, trend analysis, Fibonacci analysis, and more. The curriculum is designed to provide a solid foundation in technical analysis, catering to beginners as well as intermediate traders. Practical Training: We emphasize practical training, allowing you to apply the concepts learned in real-time market situations. Through simulated trading exercises and case studies, you can gain hands-on experience and build confidence in your technical analysis skills. Real-World Application: Our technical analysis course in Delhi focuses on the practical application of technical analysis in real-world trading situations. We provide examples and case studies from actual market data to help you understand how technical analysis can be used to make informed trading decisions.
Customized Learning: We understand that different learners have different needs, and our course offers flexibility to cater to individual learning styles. You can learn at your own pace and focus on specific topics of interest to suit your needs. Proven Trading Strategies: The best technical analysis course online includes proven trading strategies that are based on technical analysis principles. These strategies are taught in a practical manner, allowing you to apply them in real-time trading scenarios to improve your trading performance. About us Other More Legal & Support Contact Us > My Ism > Important Links > Job Openings > Site Map Moti Nagar – 9354809292 > Our Mentors > Reviews > Talent acquisition > Feedback Nehru Place – 8810494436 > Free Demat Account > Admission Guidelines > Mock Test > Privacy Policy > Internship Programme > Blog > Question Bank > Library membership Copyright © 2022. All rights reserved. ISM Institute of Stock Market Delhi. DISCLOSURE OF RISK: Trading in Futures and Forex involves a high amount of risk and is not suitable for every investor. An investor could lose from a little to all of his initial investment in the market. Risk capital refers to the amount of money that can be lost without compromising a trader’s lifestyle or financial stability. Only such a capital should be used for trading. A trader’s past performance is never an indicator of future results. GIVEN BELOW ARE SOME OF THE DRAWBACKS ASSOCIATED WITH THE HYPOTHETICAL PERFORMANCE RESULTS: THERE IS NO SURETY THAT THE HYPOTHETICAL RESULTS WILL BE REFLECTED IN THE ACTUAL RESULTS, RATHER, THERE ARE GENERALLY HUGE DIFFERENCES BETWEEN THE ACTUAL RESULTS AND THE HYPOTHETICAL PERFORMANCE RESULTS THAT ARE ACHIEVED BY A PARTICULAR TRADING SETUP. ALSO, HYPOTHETICAL TRADING DOES NOT INVOLVE FINANCIAL RISK AND SUCH TRADING SYSTEM CAN NEVER PREDICT THE RISK INVOLVED IN THE ACTUAL TRADING SETUP. FOR AN INSTANCE, THE ABILITY TO WITHSTAND A GIVEN AMOUNT OF LOSS OR TO STICK TO PARTICULAR TRADING STYLE ARE CERTAIN POINTS WHICH CANNOT BE DISMISSED OUT OF CONSIDERATION. WHILE PREPARING HYPOTHETICAL TRADING PROGRAM, THERE ARE VARIOUS FACTORS WHICH CANNOT BE TAKEN INTO ACCOUNT WHICH ADVERSELY AFFECT THE ACTUAL TRADING SETUP. PDFmyURL.com - convert URLs, web pages or even full websites to PDF online. Easy API for developers!