Download
1 / 32
500 likes | 1.33k Views
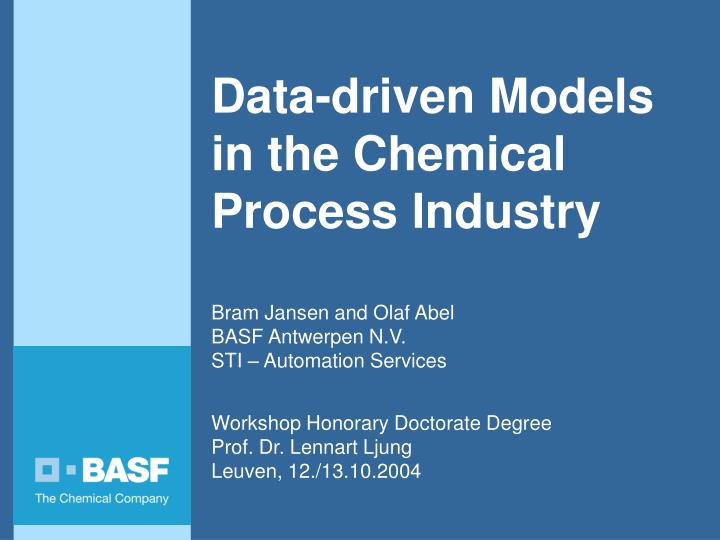
Data-driven Models in the Chemical Process Industry. Bram Jansen and Olaf Abel BASF Antwerpen N.V. STI – Automation Services Workshop Honorary Doctorate Degree Prof. Dr. Lennart Ljung Leuven, 12./13.10.2004. Agenda. Introduction to BASF and its Antwerp site

E N D
Data-driven Modelsin the Chemical Process Industry Bram Jansen and Olaf AbelBASF Antwerpen N.V.STI – Automation Services Workshop Honorary Doctorate Degree Prof. Dr. Lennart Ljung Leuven, 12./13.10.2004
Agenda • Introduction to BASF and its Antwerp site • Drivers and challenges in chemical process industry • Opportunities • Case Studies • Reflection and conclusion
BASF – The Chemical Company • The world‘s leading chemical company • Product segments: plastics, chemicals, performance products, agriculture & nutrition products, oil & gas • Successful due to global presence, Verbund, active portfolio management • Number of employees (30.6.2004): 85.124 • Financial results (2003): • Sales: 33.361 Mio € • EBIT: 2.658 Mio € • Cashflow: 4.878 Mio €
BASF Antwerpen N.V.2nd largest production site of BASF group
BASF Antwerpen N.V.Some key data • Located in most northerly part of the Antwerp port • Largest chemical production site in Belgium,total surface: 598 ha, approximately 65% developed • 3.700 BASF employees and 1.400 from associates companies • Financial results (2003): • Sales: 3.666 Mio € • EBIT: 383 Mio € • Cashflow: 468 Mio € • Energy consumption (2003): 10,3 TWh (3,5 % of Belgium)
Integrated Production Site (Verbund)54 plants in 4 production sectors Plastics and Fibers(46,0%) Chemicals and other products(35,3%) Fertilizers and Inorganics(9,7%) Performance Products(8,9%) BASF-products polyurethane raw materials, polystyrene, ethylbenzene, styrene, Styrolux®, ABS,caprolactam ethylene, propylene,benzene, PIB, amines. nitric acid, sulphuric acid,ammonia, compound andsimple fertilizers ethylene oxide, glycol, acrylic acid, superabsorbers Applications household appliances, toys, sports equipment, insulating and packing material, seats,car parts, carpets, nylon, … crop-protecting, pharmaceutical products, additives for fuels and lubricants, ... fertilizers anti freeze, detergents,PET bottles, diapers, …
Automation Services – Central competence center for Operations Enterprise Resource Planning,Business IT, SAP/R3 BASF IT Services N.V. ERP Advanced Process Control, Real-time Optimization APC, RTO Process InformationManagement Systems PIMS, LIMS Automation Services Process Control DCS, PLC Measure, Communicate Field Devices & Infrastructure Operate Plant Operations
Agenda • Introduction to BASF and its Antwerp site • Drivers and challenges in chemical process industry • Opportunities • Case Studies • Reflection and conclusion
The Chemical Industry in Europe • Total GDP grows with approximately 2%. • Chemical market growth below average GDP growth. • Most investments go to Middle or Far East, in particular China. • High dependence on external influences (feedstock prices). • Increasing competition. The existing plant capacityhas to be used optimally!
The interesting quantities are often difficult to measure. • The influence of the DoF on the OF is not obvious. • The used problem formulation isplant-specific andtime-dependent. Achieving optimality • Possible objective functions (OF): • throughput, conversion, … • raw materials, energy, … • product specification • Degrees of freedom (DoF)(controller setpoints) • Constraints: • product quantities • product qualities • safety Optimal operation is only achievable by applying process models!
Different types of models Possible requirements: • Dynamic • Nonlinear behaviour • Resolution in time and space • Extrapolation capabilities • Property distributions First principles: • Based on balance and phenomenological equations • Process knowledge required • Comparatively expensive Data driven: • Identified using process data • Comparatively inexpensive
Agenda • Introduction to BASF and its Antwerp site • Drivers and challenges in chemical process industry • Opportunities • Case Studies • Reflection and conclusion
server PC PC PC collector router DCS Data collection • PIMS: Plant Information Management System • Long term data historian(> 5 years online data) • Link between process controland office/engineering world • Site infrastructure(> 90.000 tags covered) • Similar technology availablefor laboratory data: LIMS(currently 5.000 sample points)
Steady state Dynamic Models • ARX, ARMAX, OE, BJ, … • Finite Impulse Response • State Space • Least Squares • Subspace identification • Prediction error methods • Numerical optimization Identification Model structures andidenfication techniques • Multiple Linear Regression • PCA and PLS • Neural Networks • Least Squares • Backpropagation • Numerical optimization
Software tools used within BASF • SAS – JMP • IPCOS – Presto • Mathworks – MATLAB System Identification Toolbox • Tailored applications
General methodology to developdata-driven models • Integration of knowledge • linear / non linear • static / dynamic • Experiences • Feasibility • Requirements • Noise • Disturbances • Maintenance model structure selection and parameter estimation Fine tuningand confidence interval Pre- processing raw data Online application Preliminary investigation • Validation • Interpolation • Outlier detection • Analysis • Sensitivity analysis
Agenda • Introduction to BASF and its Antwerp site • Drivers and challenges in chemical process industry • Opportunities • Case Studies • Reflection and conclusion
QI QI Case 1: Polymer production • Process with inherent time lags and dead times • Production of 2 different grades • Relative viscosity (polymer / solvent) is main product specification laboratory analysis Reaction Granulation Extraction Drying Monomer Polymer 15 h 18 h
η = f(T,p,m) ● Soft sensor for relative viscosity • Relative viscosity is measured twice per day with high precision (0.01) • (laboratory / offline) analysis time is 4h • Potential in avoiding off-spec production: • fast detection of new product specification during grade change • fast reaction on disturbances influencing relative viscosity • reduction in number of (expensive) offline analysis continuously and easily measurable variables predictionof relativeviscosity model
Engineering and implementation UNILAB(Siemens) PHD(Honeywell) Digital Control System EXCEL(MS) JMP(SAS) PRESTO(IPCOS)
Relative Viscosity after drying laboratoryanalysis soft sensor 18 months Results: comparison model / analysis • 2 models (low/high grade)after granulation • 2 models (low/high grade)after drying • Multiple LinearRegression (MLR) • 13 - 17 input parameters(reaction and granulation section)
model based sensor labo analysis Relative viscosity 19.2.2003 25.2.2003 28.2.2003 22.2.2003 Relative viscosityis provided continuouslywith high precision! Results: grade change • RMSE < 0.009 • 80% of errors < 0.01 • 98% of errors < 0.02
Case 2: Steamcracker • Largest plant at BASF Antwerpen N.V. • Consumes appr. 2,6 Mio. t/a of feedstock (mainly naphtha) Capacity: • C2: 800.000 t/a • C3: 500.000 t/a • C4: 300.000 t/a • Benzene, TX • …
C H 2 4 C C H H 2 2 4 4 Mass fraction C H 3 6 C C H H 3 3 6 6 H 2 H H 2 2 Cross over temperature 4 4 H H Classical application area formodel-based optimization and multivariable predictive control! 2 2 900 ºC 900 ºC C C 850 ºC 850 ºC Mass fraction Residence time Residence time Operational environment of the steamcracker • Many operational degrees of freedom • A lot of changing operating conditions • feedstock qualities, • feedstock and product prices, • furnace decoke
Hold plant at optimal operating point: setpoint setpoint (from optimizer) (from optimizer) • Enforce constraints! • Prevent interaction among SISO control loops! • Minimize necessary control action! controlled variable controlled variable (predicted) (predicted) measured measured manipulated manipulated variable variable time time control horizon control horizon prediction horizon prediction horizon Model Predictive Control • Multivariable • Rigorous incorporation of constraints • (Limited) optimization capabilities
Engineering and implementation • Process data collected by executing step tests • PRBNS input • Mainly FIR models(linear application) • Identification basedon LS algorithms
Process Part MV FF CV Naphtha or LPG furnace 9 7 34 Ethane furnace 10 11 36 Cold side 36 20 82 Depropanizer 5 14 11 Propylene fractionator 11 29 9 Feedmaximizer 143 137 448 Size of the controller
Ethylene loss in bottom ethane Results: C2 splitter (separation ethane/ethylene) Feed to C2 splitter Ethane pollution intop ethylene product
Results: C3 splitter – two colums(separation propane/propylene) Propane in top propylene product(1. and 2. column) Combinedfeed to both columns Propylene loss in bottom propane (1. and 2. column)
Agenda • Introduction to BASF and its Antwerp site • Drivers and challenges in chemical process industry • Opportunities • Case Studies • Reflection and conclusion
Reflection with academic research • Chemical processes are nonlinear and time-variant. • Nevertheless, the examples are all dealing with linear technology. • Within the domain of linear techniques, the simple methods are used. • Theoretical properties are neglected in most cases. • Only some attempts exist to useadvanced technologies(polymer processes,batch processes, …). • The (economical) justificationfor using those technologieshas to be provided.
Conclusions • Data-driven models help to improve the operation of chemical processes and to drive them towards optimality. • The necessary infrastructure (PIMS, LIMS) is far developed. • The number of applications of data-driven models is growing. • In most cases, linear technology is applied. • The time might have come to do the next step. • Contiuous exchange between academia and industry is permanently required in order to identify appropriate application areas for current research activities.