Download
1 / 19
190 likes | 640 Views
Visualisation of Neighbourhood Statistics using Google Earth. Olav ten Bosch and Edwin de Jonge Statistics Netherlands UNECE - Meeting on the Management of Statistical Information Systems (MSIS) Luxembourg, 7-9 April, 2008. Contents. Introduction Regional Statistics in StatLine

E N D
Visualisation of Neighbourhood Statistics using Google Earth Olav ten Bosch and Edwin de Jonge Statistics Netherlands UNECE - Meeting on the Management of Statistical Information Systems (MSIS) Luxembourg, 7-9 April, 2008
Contents • Introduction • Regional Statistics in StatLine • Traditional mapping versus streaming photo-based mapping • A dual Approach: • CBS in your neighbourhood • Google Earth layer • Work in progress • Conclusions
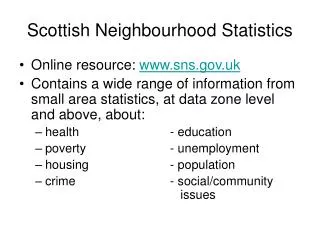
Introduction Statistics Netherlands has many statistics at neighbourhood level Available in statistical database StatLine Regional statistics can be presented more attractive and understandable in maps StatLine maps: generated on the fly from the database SVG (less popular and problematic in browsers) People have to “know” how to generate a map There must be a better solution
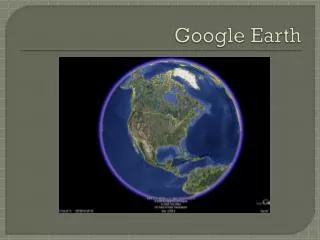
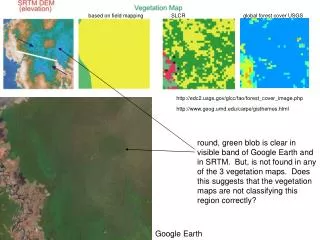
Traditional mapping versus streaming photo-based mapping Traditional mapping: Each mapping engine has its own user interaction mechanism The user has to specify certain parameters Maps are sent over completely Streaming photo-based mapping: de-facto user interaction (zooming, panning etc) Combining air- or satellite photos with other information Efficient streaming mechanism for (geo)data Extendable, you can add other information layers Only a few flavors: Google Earth / maps Microsoft Virtual Earth OpenStreetmap Statistics should use this trend
Maps people use in their daily life Traffic info Houses for sale Crime facts
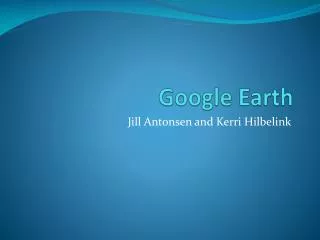
A Dual approach • We use general mapping technology • Google maps and Google earth • People “know” these interfaces • 11,000 neighbourhoods: • Detailed borders • 21 variables (inhabitants, income, age) • Two “products”: • “CBS in your neighbourhood”: • http://www.cbsinuwbuurt.nl/ • Website for everyone, no plugins required • “CBS on Google Earth”: • for advanced users • CBS layer accessible from CBS website • http://www.cbs.nl/gearth (Dutch version) • http://www.cbs.nl/.../gearth.htm (English version)
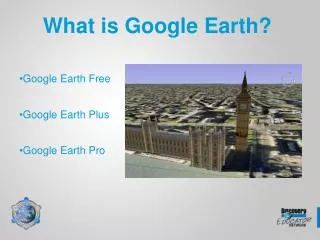
CBS created statistical layer for GEarth: GEarth free tool (needs to be installed) GEarth has a well-defined data format (KML) Two ways to access: CBS data in next (Dutch) GEarth release Google Earth layer available on website CBS Use streaming mechanism of GEarth for efficient data transport: Only the data of the viewing area is sent over Ability to combine statistical data with other geodata “CBS on Google Earth”
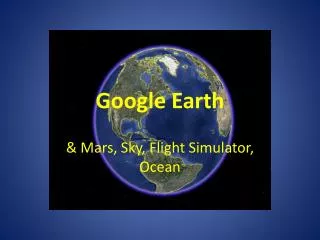
Heat maps for regional variables: Population density Ratio of men to women Other variables Animated statistics: Use the time facility to visualise statistical trends Changing neighbourhood borders Changes in population, age, households etc. Work in progress
Conclusions • Follow the trend: • In addition to traditional maps we use modern web-based streaming mapping techniques for dissemination of regional statistics • Dual approach for different user groups: • Easy site CBS in your Neighbourhood for everyone • Google Earth layer for advanced use • Work in progress: • Projecting variables on GEarth • Animation