Download
1 / 50
500 likes | 986 Views
Australian Construction Industry Forum Construction Forecasting Council (CFC) www.cfc.acif.com.au 13th Forecast June 2008. Outline. Forecasting Backdrop Track Record Overview of Forecasts Residential Building Non-Residential Building Engineering Construction. CFC project.

E N D
Australian Construction Industry Forum Construction Forecasting Council (CFC)www.cfc.acif.com.au 13th Forecast June 2008
Outline • Forecasting Backdrop • Track Record • Overview of Forecasts • Residential Building • Non-Residential Building • Engineering Construction
CFC project • Forecasting construction to improve the industry’s knowledge base • 1st CFC forecasts were published March 2002. • CFC forecasts are updated half-yearly and published free on: www.cfc.acif.com.au • The 13th CFC forecasts begin from 2008Q1 • Three broad construction sectors: • residential building • non-residential building • engineering construction
20 Construction types Residential Building Engineering Construction Non-Residential Building Forecast outputs by 4 types by 9 types by 7 types Type by 6 capital cities, 6 rest of states & 2 territories by 6 capital cities, 6 rest of states & 2 territories Geographic Detail by 8 states & territories Time horizon & frequency Short Term (8 quarters) & Long Term (9 years)
Nature of Forecasts • We forecast ABS data so the accuracy of the forecasts is readily checkable from credible, published data • stage: • approvals -> commencements -> work done -> completions • seasonality: • original / seasonally adjusted / trend • nominal or real: • values / chain volume • normal annual economic growth around 3% • normal inflation around 2.5%, • = normal growth in (nominal) construction is 5-6%
4 Elements to Forecast Work Done 1. Fixed Investment demand by 18 Industries (based on economic fundamentals in MM2) Construction Investment demand by 18 Industries 2. Industry intelligence (CFC) Construction Investment demand by 20 types 4. Upcoming Engineering projects Building and Engineering starts by type 3. Building approvals by type Work done by type by region
Macro Assumptions latest in 12 months Long Run Wage inflation 4.6 (to 07Q4) 5.6 3.9 Unemployment 4.2 (Apr 08) 5.1 5.2 CPI inflation 4.2 (to 08Q1) 2.9 2.6 GDP (rolling year) 4.2 (to 08Q1) 1.9 3.3 Cash rate 7.25 (June 08) 7.0 5.5 10-year bond 6.5 (June 08) 6.5 5.6 $A (US cents) 95 (June 08) 90 76 • Economic growth weak in 2008 due to tight financial markets, sending unemployment up. Recovery expected to begin in 2009.
Outline • Forecasting Backdrop • Track Record • Overview of Forecasts • Residential Building • Non-Residential Building • Engineering Construction
Track Record: Summary • Residential building forecasts have shown good accuracy. • Non-residential building and engineering forecasts have tended to under-predict. • They were too low for 2005/06. • Improved accuracy for 2006/07. • High accuracy for 2007/08 – new forecasts very similar to forecasts made 12 months ago. • Likely it reflects improvements to short-term forecasting methodology made 18 months ago
Outline • Forecasting Backdrop • Track Record • Overview of Forecasts • Residential Building • Non-Residential Building • Engineering Construction
Outline • Forecasting Backdrop • Track Record • Overview of Forecasts • Residential Building • Non-Residential Building • Engineering Construction
Population Assumptions history current Forecast 1997-07 2006-07 2007-17 fertility rate (a) 1.76 1.85 1.85 net o’seas migration (b) 128 178 204 net interstate migration (b): NSW -22 -27 -24 VIC 1 -2 -5 QLD 26 27 28 WA 1 4 3 (a) births per woman; (b) ‘000 persons per year
Residential Building Conclusions • After slumping in 04/05 and 05/06, residential showed signs of improvement in 06/07 with 2% real growth • Gradual recovery supported by low unemployment and shortages in housing stock caused by strong population growth • unit and townhouse building lagged behind, due to the longer construction pipeline compared with houses. • But now a pause in residential recovery due to tight credit: • high interest rates and tight finance constraining housing market • weak growth of only 1% (real) in 2007/08, followed by 2% in 2008/09 • but solid growth of 5% for 2009/10 when true recovery gets underway
Outline • Forecasting Backdrop • Track Record • Overview of Forecasts • Residential Building • Non-Residential Building • Engineering Construction
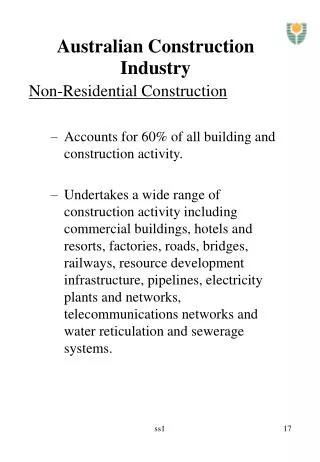
Non-Res Building Conclusions • Total non-residential building has been rising solidly • real rises of 11% in 2005/06 and 9% in 2006/07 • estimated solid real growth of 7% in 07/08 • recovery in offices • several large health projects starting • accommodation is being held back by weakness in tourism • Activity flat in 08/09 with fall in 09/10 (1%, -5%) • industrial building work done to fall in 08/09 as manufacturing industry suffers from the high $A • office building and health building commencements to fall in 08/09 after completion of large projects
Outline • Forecasting Backdrop • Track Record • Overview of Forecasts • Residential Building • Non-Residential Building • Engineering Construction
Forecast major engineering starts project type target start value ($bn) Pluto LNG WA mining 07Q3 9.0 Port Philip Dredging VIC harbours 08Q1 0.8 Kipper Gas VIC mining 08Q2 1.2 Worsley Alumina WA mining 08Q2 1.6 North Rankin Gas WA mining 08Q3 4.1 Sugarloaf Interconnector VIC water 08Q3 0.6 Airport Link QLD road 08Q4 2.9 Gorgon LNG WA mining 08Q4 9.0 Wiggins Island terminal QLD rail 09Q1 1.0 North West Metro NSW rail 09Q3 10 Wonthaggi Desal. Plant VIC water 09Q3 1.8
Engineering Const’n Conclusions • Engineering is currently at a very high level • strong real growth of 26% in 2005-06 and 8% in 2006-07 • driven by mining investment boom from China-induced boost to commodity prices • Engineering is expected to continue growing solidly due to infrastructure investment • real rise of 12% in 2007-08 then 13% in 2008-09 • mining boom to near its peak in 2008-09 with markets expecting terms of trade to fall from 2009-10 • source of growth in engineering to switch from mining to roads, electricity and water, as infrastructure investment strengthens
13th Forecast: General Conclusions • Residential building recovery has paused, due to tight financial market conditions, but relief from 2009/10. • Non-residential building to fall in 2009/10 - the high Australian dollar hits industrial building and the office upswing ends; but growth from education and health. • Engineering construction to continue solid growth. After 2008/09, the main source of growth switches from mining to roads, electricity and water projects. • Demand for construction labour reaches a plateau in 2008/09, moderating wages growth thereafter.