Download
1 / 2
20 likes | 26 Views
Geo data visualization is the process of displaying geographical data in a way that makes it easier to understand and analyze.

E N D
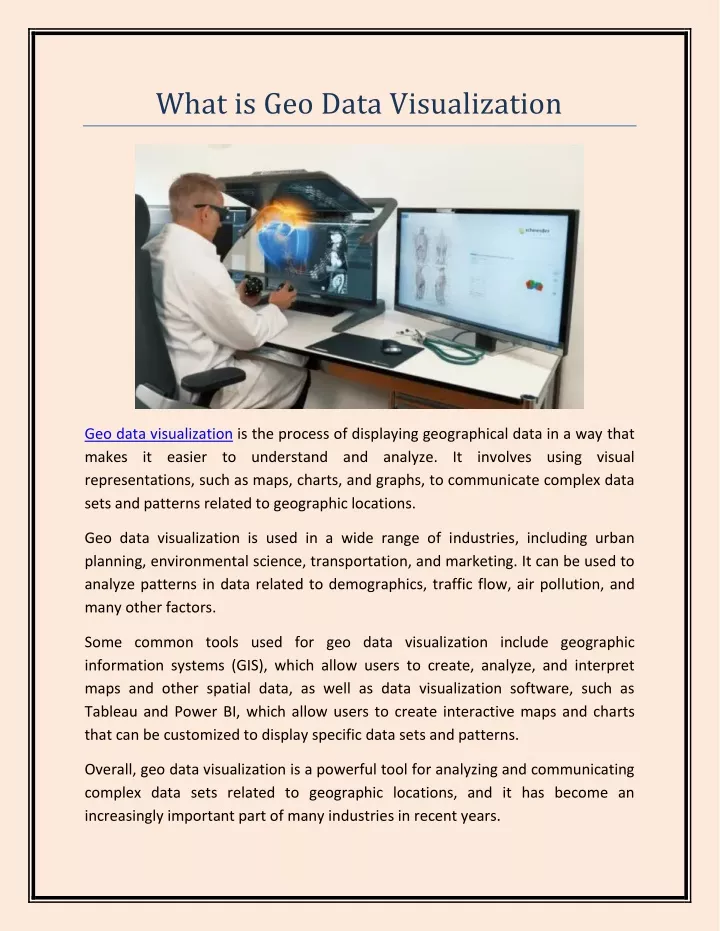
What is Geo Data Visualization Geo data visualization is the process of displaying geographical data in a way that makes it easier to understand and analyze. It involves using visual representations, such as maps, charts, and graphs, to communicate complex data sets and patterns related to geographic locations. Geo data visualization is used in a wide range of industries, including urban planning, environmental science, transportation, and marketing. It can be used to analyze patterns in data related to demographics, traffic flow, air pollution, and many other factors. Some common tools used for geo data visualization include geographic information systems (GIS), which allow users to create, analyze, and interpret maps and other spatial data, as well as data visualization software, such as Tableau and Power BI, which allow users to create interactive maps and charts that can be customized to display specific data sets and patterns. Overall, geo data visualization is a powerful tool for analyzing and communicating complex data sets related to geographic locations, and it has become an increasingly important part of many industries in recent years.
What Industries Use Geo Data Visualization Geo data visualization is used in a wide range of industries, including: 1.Urban Planning: Geo data visualization is used to analyze data related to population growth, land use, transportation, and other factors to inform urban planning and development decisions. 2.Environmental Science: Geo data visualization is used to analyze data related to air and water quality, land use, and other factors to inform environmental management and conservation efforts. 3.Transportation: Geo data visualization is used to analyze traffic flow patterns, identify congestion hotspots, and optimize routing for vehicles and transportation networks. 4.Marketing: Geo data visualization is used to analyze demographic data, consumer behavior, and other factors to inform marketing strategies and targeted advertising. 5.Real Estate: Geo data visualization is used to analyze property values, sales trends, and other factors to inform real estate development and investment decisions. 6.Emergency Management: Geo data visualization is used to analyze data related to natural disasters, public health emergencies, and other crises to inform emergency response and management efforts. 7.Agriculture: Geo data visualization is used to analyze data related to crop yields, soil quality, weather patterns, and other factors to inform agricultural management and production decisions. Overall, geo data visualization is a valuable tool in many industries, helping to analyze complex data sets related to geographic locations and inform decision- making processes. Source Link: https://bit.ly/3zMRP1o