Download
1 / 10
190 likes | 2.26k Views
Ea. Potential Energy (Ep). Fraction of molecules. Path of reaction . Kinetic energy . kinetic vs. potential energy diagrams. Recall the Maxwell-Boltzman distribution (i.e. kinetic energy diagram).

E N D
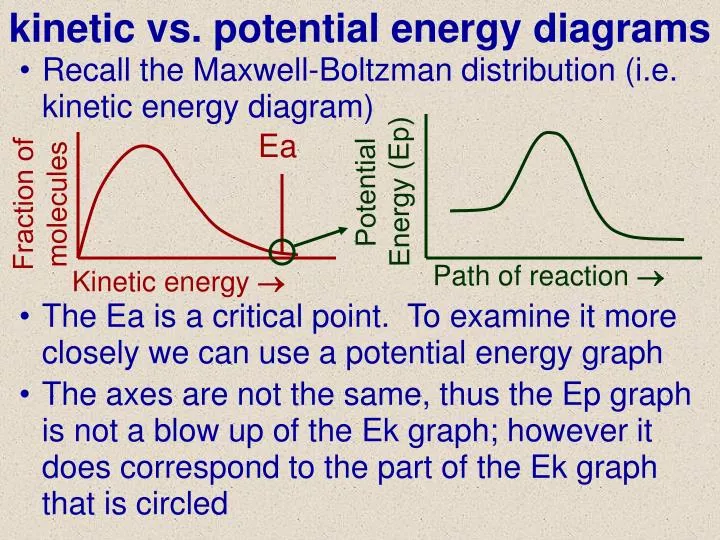
Ea Potential Energy (Ep) Fraction of molecules Path of reaction Kinetic energy kinetic vs. potential energy diagrams • Recall the Maxwell-Boltzman distribution (i.e. kinetic energy diagram) • The Ea is a critical point. To examine it more closely we can use a potential energy graph • The axes are not the same, thus the Ep graph is not a blow up of the Ek graph; however it does correspond to the part of the Ek graph that is circled
Activated complex / transition state Ea Ep (Potential energy stored in chemical bonds) H Collision begins Collision ends Path of reaction potential energy graph: a closer look Reactants Products A2 & B2 rush together molecules slow down Ep , Ek molecules speed up Ep , Ek 2AB molecules float apart Ep + Ek =constant throughout Overall Ep(reactants)>Ep(products) Ek(reactants)<Ek(products)
Ea forward Ep Ea reverse H is positive Ep graph: Important points Exothermic Endothermic • Forward and reverse reactions are possible • Ea is the difference between Ep at transition state and initial or final Ep • The graph depicts an exothermic reaction. Endothermic reactions are also possible • H is the difference between initial and final Ep. It is -ve for exothermic,+ve for endothermic
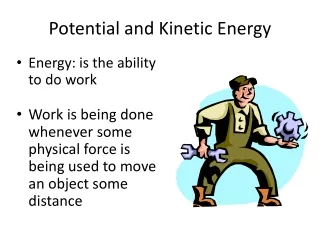
The collision theory • Related to the Ep graph is the “collision theory” - the idea that for molecules to react they must meet with sufficient force • Factors that affect reaction rate can be explained via the collision theory: • Increased temperature causes molecules to move faster (increased number of collisions per unit time and greater kinetic energy) • Increased concentration means more collisions • Homogenous reactions occur faster because reacting molecules collide more frequently • Catalysts decrease Ea, decreasing the amount of kinetic energy needed to overcome Ea
Fraction of molecules potential energy Kinetic energy Path of reaction Catalysts • Recall, catalysts speed a reaction • This can be explained by the Ek or Ep graphs • In both, the catalyst works by lowering the Ea: • Catalysts speed forward and reverse reactions • However, most reactions favour the side that has the lowest potential energy (most stable) • Catalysts are heterogenous or homogenous • They provide a substrate (p. 768) for a reaction or they can bond temporarily to a molecule, increasing the odds of a favourable meeting
Transition state lab: purpose Purpose: 1) to visualize an activated complex, 2) to observe the influence of a catalyst We will be examining the following reaction: NaKC4H4O6(aq) + H2O2(aq) CO2(g) + … Procedure: • Turn hot plates immediately to medium heat • Get a 10 mL graduated cylinder, a 100 mL beaker, a test tube, and a rubber stopper. • Weigh1.7gNaKC4H4O6.Addtobeakeralong with 10 mL distilled H2O. Swirl to dissolve. • Add 4.5 mL of 10% H2O2 to beaker. Heat. • Get 5 mL of CoCl2 but don’t add it yet.
Transition state lab: procedure Procedure: • As soon as tiny bubbles start to form and rise, remove the beaker from the hot plate. Add the CoCl2 at this point. • Record your observations (in order to answer the questions). Clean up – wash everything down the drain, wipe off your lab bench. Questions: answer on a separate sheet of paper • Look at the chemical equation that represents the reaction. What physical sign will there be when a reaction is occurring? • The products of the reaction are colourless. What colour are the reactants?
Transition state lab: conclusions Questions: read 18.11 (pg. 767 – 769) • What was the catalyst in the lab? What colour was it? Is it homogenous or heterogeneous? • At the beginning of step 5, both reactants were present; why was there no reaction? (Illustrate with a Ek diagram). • Why is the reaction still slow after heat is added? (illustrate using the Ek diagram) • Was the catalyst a different colour at the end of the experiment than at the beginning? • What colour was the activated complex? • Illustrate the affect the catalyst had on the reaction (using both Ek and Ep diagrams)
Fraction of molecules Kinetic energy Answers • The production of CO2 (bubbling) is a physical sign that the reaction is occurring • The reactants are colourless • CoCl2 was the catalyst in the lab (pink, homogenous) • There was no reaction because the Ea was not reached (Illustrate with a Ek diagram). • The reaction still slow after heat is added because very few molecules exceed Ea.
Fraction of molecules potential energy Kinetic energy Path of reaction Answers • The catalyst was the same colour at the end of the experiment (catalysts don’t change). • The activated complex was green • Illustrate the affect the catalyst had on the reaction (using both Ek and Ep diagrams) For more lessons, visit www.chalkbored.com