Download
1 / 23
280 likes | 980 Views
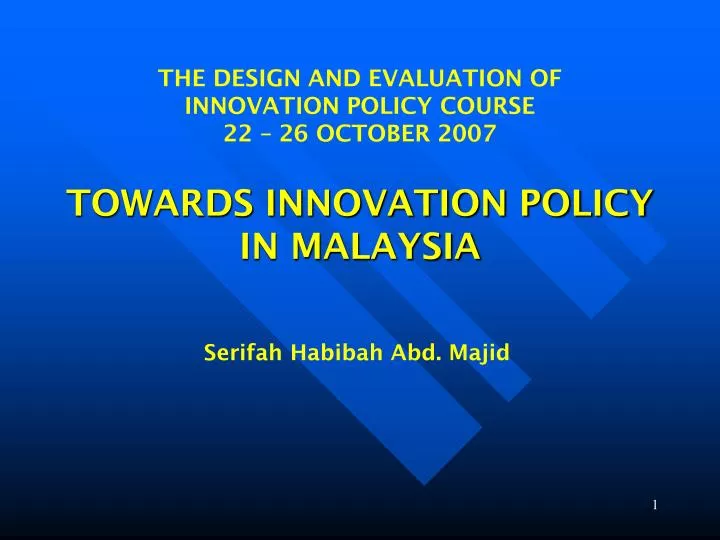
THE DESIGN AND EVALUATION OF INNOVATION POLICY COURSE 22 – 26 OCTOBER 2007. TOWARDS INNOVATION POLICY IN MALAYSIA. Serifah Habibah Abd. Majid. BRIEFING OUTLINE. Malaysia in Brief Current Status of Initiatives Towards Innovation Policy Achievements. MALAYSIA in Brief.

E N D
THE DESIGN AND EVALUATION OF INNOVATION POLICY COURSE 22 – 26 OCTOBER 2007 TOWARDS INNOVATION POLICY IN MALAYSIA Serifah Habibah Abd. Majid
BRIEFING OUTLINE • Malaysia in Brief • Current Status of Initiatives Towards Innovation Policy • Achievements
MALAYSIA in Brief General Indicators/Info • Area : 330 252km2 (Peninsular Malaysia + Sabah + Labuan + Sarawak) • Population : 27.6 million • Multi-ethnic country (Malay, Chinese, Indian etc) Economic Indicators • Labour Force : 11.8 million • Percentage of Unemployment : 3.5% • GDP : RM546.3 billion (USD147.6 billion) • Per capita income : USD 5,388 • Comparison of GDP % p.a.
INNOVATION GOVERNANCE STRUCTURE NATIONAL INNOVATION COUNCIL (NIC) Chairperson : Hon. Prime Minister SECRETARIAT Ministry of Science, Technology & Innovation NIC WORKING COMMITTEE Chairperson : Hon. Minister of Science, Technology & Innovation
STRUCTURAL SUPPORT NATIONAL INNOVATION COUNCIL • Announced by the Hon. Prime Minister in April 2004 • Shift in thinking – initial intention as an umbrella body for R&D activities
TechnoFund ScienceFund FINANCIAL SUPPORT 3 Grant Schemes to move economy up the value chain InnoFund
THE END TO END VALUE CHAIN PRE-R&D R&D PRE-COM COMMERCIALISATION Incubation/ Early Growth Value Realisation Prototype Development Mature Stage Pre-R&D Process Value Analysis Concept/ Idea Basic R Applied R Pilot Plant / CR Prototype ScienceFund Priority Setting, Technology Scanning TechnoFund CRDF,TAF/ TAF-W VCs, MAVCAP,MOF, Industries
TechnoFund ScienceFund InnoFund SCIENCEFUND • To generate new knowledge through basic and applied sciences; • To develop laboratory proof of concept; and • To enhance research capability and increase number of researchers. Allocation under the 9th Malaysia Plan – RM 1.2 Billion
TechnoFund ScienceFund InnoFund TECHNOFUND • Stimulate the growth and successful innovation of Malaysian medium and large enterprises by increasing the level of R&D to market or commercialisation. • Increase capability and capacity of Malaysian IHL and RI to commercialise the R&D findings through spin-offs / licensing. Allocation under the 9th Malaysia Plan – RM 1.3 Billion
TechnoFund ScienceFund INNOFUND InnoFund Individual, Micro and Small Enterprises Development of new or improvement of existing products, process or services with elements of innovation Community Groups Conversion of knowledge / idea into products / process / services that improve the quality of life of communities Allocation under the 9th Malaysia Plan – RM 0.2 Billion
S&T INDICATORS, 1998 - 2004 2004 1998 2000 2002 Total R&D Expenditure (RM million) Public Private R&D expenditure as a percentage of GDP Number of researchers R&D efforts spent as a percentage of headcount (FTE) Number of researchers per 10,000 labour force 2,843.8 810.2 2033.6 0.63 23,092 58% 21.3 1,127.0 380.9 746.1 0.39 6,249 55% 7 1,671.5 703.6 967.9 0.5 15,022 43% 15.6 2,500.6 867.5 1633.1 0.69 17,790 43% 18 Note : FTE - Full Time Equivalent is based on the actual proportion of time spent on R&D. Source : National Survey of R&D 2006
Cont… S&T INDICATORS, 1998 - 2004 1996 2004 1998 1998 2000 2000 2002 2002 1,999 176 1,823 1,549 24 1,525 Total Patents Filed - Resident - Non-resident Total Patents Granted - Resident - Non-resident 5,963 193 5,770 566 21 545 6,227 206 6,021 405 24 381 4,937 322 4,615 1,492 32 1,460 Source : MOSTI Facts & Figures 2006
MAJOR ICT INDICATORS Source : MOSTI Facts & Figures 2006
International Comparison Note: Figure 2004 SOURCE: MOSTI National Survey on R&D 2006
TERMS OF REFERENCE NATIONAL INNOVATION COUNCIL • To provide the strategic direction for enhancing the innovative capacity and accelerating the pace of innovation in the nation • To oversee the coordination of policy initiatives that impact on innovation • To oversee the development of a creative and entrepreneurial society • To assess the state of innovation in the country and the extent they meet prescribed national vision and objectives
TERMS OF REFERENCE NIC WORKING COMMITTEE
VISION 2020 • ULTIMATE OBJECTIVE • a fully developed country by the year 2020 • The sixth challenge • establishing a scientific & progressive society, a society that is innovative & forward-looking, one that is not only a consumer or technology but also a contributor to the scientific & technological civilization of the future.
NATIONAL VISION POLICYMaster Plan For Knowledge Based Economy • To increase international competitiveness - competition among the developing and developed countries for FDI • The Information Age The challenge : to transform into the K-economy, with potential growth by moving into a new and higher trajectory
1st key thrust • To move the economy up the value chain 2nd key thrust • To raise capacity for knowledge and innovation