Download
1 / 14
140 likes | 1.23k Views
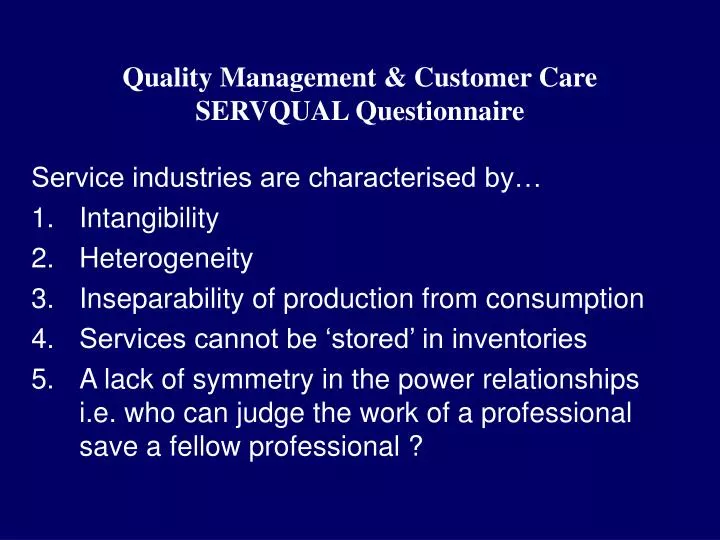
Quality Management & Customer Care SERVQUAL Questionnaire Service industries are characterised by… Intangibility Heterogeneity Inseparability of production from consumption Services cannot be ‘stored’ in inventories

E N D
Quality Management & Customer CareSERVQUAL Questionnaire Service industries are characterised by… • Intangibility • Heterogeneity • Inseparability of production from consumption • Services cannot be ‘stored’ in inventories • A lack of symmetry in the power relationships i.e. who can judge the work of a professional save a fellow professional ?
Quality Management & Customer CareSERVQUAL Questionnaire The Parasuraman, Zeithaml and Berry model.. • Originally identified 10 dimensions of quality and developed a list of 97 items on a seven point scale… • After testing and subsequent refinement (i.e. factor analysis) the list was collapsed into a 22-item questionnaire covering 5 dimensions..) called SERVQUAL
Quality Management & Customer CareSERVQUAL Questionnaire • Tangibles (environmental factors) • Reliability • Responsiveness • Assurance • Empathy These factors would differ in importance from service to service e.g. reliability is more important in a bank, empathy in a hospital!
Quality Management & Customer CareSERVQUAL Questionnaire Gap analysis The questionnaire is divided into 2 main sections: • Expectations measures what is anticipated in an ideal service (on a 7-point scale) • Perceptions then measures those aspects of the service as actually delivered or experienced • Satisfaction (S) is conceptualized as the gap between expectations and perceptions • So.. S=E-P
Quality Management & Customer CareSERVQUAL Questionnaire How are expectations formed ? • Frequency and length of use of the service- the gap will narrow over time • Services affect consumers differently (house repair differs from an operation for cancer) • Expectations are influenced by knowledge held by producers/consumers about what is feasible • Attitudes (formed by previous bad experiences) may indicate lower expectations • Feelings are important (e.g. at times of grief)
Quality Management & Customer CareSERVQUAL Questionnaire Three common mismatches are: • Consumer expectations vs. management expectations of what the service should be • Actual service delivery vs. information about the service • Expected service vs. perceived service
Quality Management & Customer CareSERVQUAL Questionnaire USA General Sample [1990] Dimension Weight Perceptions Expectations Gap ──────────────────────────────────────────────────────── Tangibles 0.11 5.54 5.16 +0.38 Reliability 0.32 5.16 6.44 -1.28 Responsiveness 0.22 5.20 6.36 -1.16 Assurance 0.19 5.50 6.50 -1.00 Empathy 0.16 5.16 6.28 -1.12 ──────────────────────────────────────────────────────── Weighted averages [n=1936] 5.28 6.27 -0.99 (Source: calculated from from Zeithaml, Parasuraman and Berry [1990] )
Quality Management & Customer CareSERVQUAL Questionnaire UK Hospital Outpatient SurveyDimension Weight Perceptions Expectations Gap ──────────────────────────────────────────────────────────────────── Tangibles 0.13 5.21 5.24 -0.03 Reliability 0.26 5.52 6.31 -0.79 Responsiveness 0.21 5.88 6.17 -0.29 Assurance 0.20 5.98 6.39 -0.41 Empathy 0.20 5.66 6.16 -0.50 ──────────────────────────────────────────────────────────────────── Weighted averages [n= 72] 5.67 6.15 -0.48
Quality Management & Customer CareSERVQUAL Questionnaire Finland Hospital Outpatient Survey Dimension Weight Perceptions Expectations Gap ─────────────────────────────────────────────────────────────────── Tangibles 0.18 5.64 6.03 -0.38 Reliability 0.21 5.51 6.04 -0.54 Responsiveness 0.20 5.73 6.12 -0.39 Assurance 0.22 5.83 6.23 -0.40 Empathy 0.19 5.74 6.08 -0.35 ─────────────────────────────────────────────────────────────────── Weighted averages [n= 135] 5.72 6.14 -0.41
Quality Management & Customer CareSERVQUAL Questionnaire General problems with satisfaction scores • People bring differing expectations into a situation and have different starting points • To measure quality just through a satisfaction score may have a limited value • Is it the role of e.g. public services (such as a probation service) to provide satisfaction ?
Quality Management & Customer CareSERVQUAL Questionnaire Applicability in the public sector • In education it is possible that a teacher get high scores for satisfaction (whereas in practice the course was not sufficiently demanding) • In social services you could (in theory) put ‘good’ tenants in one housing unit and ‘undesirable’ tenants in another and this could increase the satisfaction scores (while being discriminatory!)
Quality Management & Customer CareSERVQUAL Questionnaire Measurement scales… ───────┼───────────────┼─────────────────────┼──────┼───── D C B A we can say that the distance __ __ __ __ AD = AB + BC + CD If these scales are genuinely ordinal, we cannot add, subtract, multiply, divide…
Quality Management & Customer CareSERVQUAL Questionnaire Reactions to SERVQUAL • Used in a large number of studies and therefore some comparability over time/between studies • Academic rather than Industry based • Does need to be combined with other measures (such as value analysis, history, competition) • Gap analysis may map imperfectly onto quality • Some doubts remain on a technical level as to what is actually being measured
Quality Management & Customer CareSERVQUAL Questionnaire Calculating SERVQUAL scores… This can be easily done… • Easily done using a spreadsheet • Utilize the SERVCALC program which mechanises the process