Download
1 / 6
60 likes | 620 Views
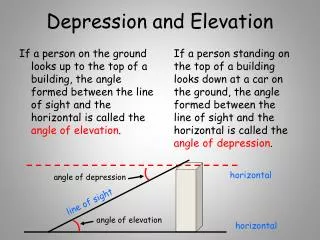
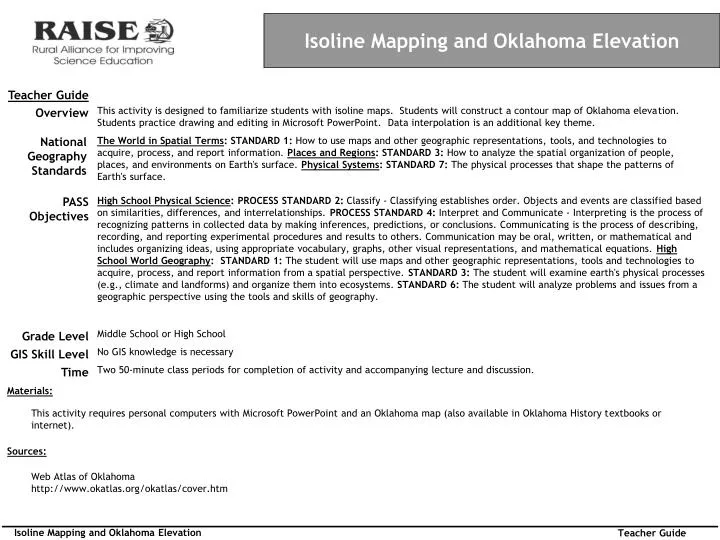
Isoline Mapping and Oklahoma Elevation. Teacher Guide.

E N D
Isoline Mapping and Oklahoma Elevation Teacher Guide This activity is designed to familiarize students with isoline maps. Students will construct a contour map of Oklahoma elevation. Students practice drawing and editing in Microsoft PowerPoint. Data interpolation is an additional key theme. Overview National Geography Standards The World in Spatial Terms: STANDARD 1: How to use maps and other geographic representations, tools, and technologies to acquire, process, and report information. Places and Regions: STANDARD 3: How to analyze the spatial organization of people, places, and environments on Earth's surface. Physical Systems: STANDARD 7: The physical processes that shape the patterns of Earth's surface. PASS Objectives High School Physical Science: PROCESS STANDARD 2: Classify - Classifying establishes order. Objects and events are classified based on similarities, differences, and interrelationships. PROCESS STANDARD4: Interpret and Communicate - Interpreting is the process of recognizing patterns in collected data by making inferences, predictions, or conclusions. Communicating is the process of describing, recording, and reporting experimental procedures and results to others. Communication may be oral, written, or mathematical and includes organizing ideas, using appropriate vocabulary, graphs, other visual representations, and mathematical equations. High School World Geography: STANDARD 1: The student will use maps and other geographic representations, tools and technologies to acquire, process, and report information from a spatial perspective. STANDARD 3: The student will examine earth's physical processes (e.g., climate and landforms) and organize them into ecosystems. STANDARD 6: The student will analyze problems and issues from a geographic perspective using the tools and skills of geography. Middle School or High School Grade Level No GIS knowledge is necessary GIS Skill Level Two 50-minute class periods for completion of activity and accompanying lecture and discussion. Time Materials: This activity requires personal computers with Microsoft PowerPoint and an Oklahoma map (also available in Oklahoma History textbooks or internet). Sources: Web Atlas of Oklahoma http://www.okatlas.org/okatlas/cover.htm Isoline Mapping and Oklahoma Elevation Teacher Guide
Isoline Mapping and Oklahoma Elevation ACTIVITY DESCRIPTION: This activity will introduce you to isoline mapping. We will learn what an isoline map is, how to read and interpret an isoline map, and also how to construct your own isoline map of Oklahoma elevation. Isoline maps illustrate lines of equal value. Some examples of isoline maps include equal precipitation (isohyets), elevation/altitude (contour lines), temperature (isotherms), barometric pressure (isobars), wind speed (isotachs), wind direction (isogon), and wind shear (isoshear). When we make an isoline map we connect equal values/points. For example we could draw a line through all cities with a temperature of 80 if we were constructing an isotherm map. Often times, however, we will be required to interpolate. Interpolation is the estimation of values between known values. Look at this example: • KEYS OF ISOLINE MAPPING • Lines connect points with theoretically equal values • Line placement based on interpolation • Intervals should always be equal • Often times, the interval space is shaded or colored • Isolines never branch or split; they only close upon themselves. City A Temp = 90 City C Temp = ? City B Temp = 70 A C B What is a reasonable interpolation for the temperature in City C? ______ With our very limited information, a good guess would be 80 degrees, since City C is half-way between the two cities with known temperature values. Isoline Mapping and Oklahoma Elevation 1
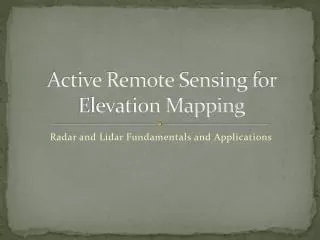
In this exercise, we are going to focus on a particular type of isoline mapping called contour mapping. Contour mapping illustrates the contours (profiles, shapes) of the land. When you make a contour map you are drawing lines that connect all places of equal elevation along a designated interval. For example, you might draw a line that illustrates the 500-foot elevation line. The space or interval between these lines is known as the contour interval. The contour interval is usually an even number such as 10 meters or 100 feet. The contour interval must always be stated. Often there will also be index contours that are illustrated with a heavier line. These index lines help you keep track of elevation when you are reading a contour map. For example, a map with a contour interval of 100 feet may utilize an index contour of 500 feet. In this case, every fifth line would be heavier/darker. Labeling your contour lines is very important. Without labels the map is useless to the reader. If a contour closes upon itself (like in the example at right), break the line and insert the label in the break. If the line goes off the page, be sure to label each end of the line. PART 1: The Practice Map Draw the contours on the practice map. Remember to label the lines. To draw lines in PowerPoint, left click on “AutoShapes,” then “Lines,” then select “Freeform.” Holding the left button down, move the cursor to draw your line. Double-click to end your line. It takes a while to get the feel of it. You may also want to try using “Curve.” With “Curve” you need to click every time your curve changes direction. If you don’t like your line, select it by clicking on it, and then press delete. Be sure you add your name in the space provided. When you finish, print your map, and let Mr. Esau or Mr. Porter check it before moving on to the Oklahoma map. Isoline Mapping and Oklahoma Elevation 2
PRACTICE MAP NAME: Isoline Mapping and Oklahoma Elevation 3
PART 2: The Oklahoma Map - Use Microsoft Encarta Atlas to locate cities. Label their elevations with text boxes. Draw and label the contours as you did on the Practice Map. Use a 500-foot interval. Don’t forget your name. Print your map when it is complete. Staple it to your Practice Map and turn them in together. NAME: CITY; COUNTY; ELEVATION ALVA; WOODS; 1362 ANADARKO; CADDO; 1178 ANTLERS; PUSHMATAHA; 470 ARDMORE; CARTER; 881 ARNETT; ELLIS; 2429 BARTLESVILLE; WASHINGTON; 715 BEAVER; BEAVER; 2504 BOISE CITY; CIMARRON; 4167 BOKHOMA; McCURTAIN; 320 CHICKASHA; GRADY; 1096 CLINTON; CUSTER; 1561 DUNCAN; STEPHENS; 1126 DURANT; BRYAN; 657 ELK CITY; BECKHAM; 1928 ENID; GARFIELD; 1246 FAIRVIEW; MAJOR; 1304 FREDERICK; TILLMAN; 1256 GUYMON; TEXAS; 3110 HOLLIS; HARMON; 1611 HUGO; CHOCTAW; 533 KENTON; CIMARRON; 4552 KINGFISHER; KINGFISHER; 1070 LAWTON; COMANCHE; 1109 McALESTER; PITTSBURG; 740 MIAMI; OTTAWA; 798 OKLA CITY; OKLAHOMA; 1243 OKMULGEE; OKMULGEE; 670 PONCA CITY; KAY; 1022 POTEAU; LEFLORE; 439 SALISAW; SEQUOYAH; 507 SEMINOLE; SEMINOLE; 862 STILLWATER; PAYNE; 883 TAHLEQUAH; CHEROKEE; 800 TULSA; TULSA; 711 WOODWARD; WOODWARD; 1910 Contour interval = 500 feet Isoline Mapping and Oklahoma Elevation 4
NAME: KEY TERMS AND IDEAS PART 3: Quiz – Print this sheet and complete this short quiz. Staple your two printed maps and this sheet together and turn them in.Don’t forget your name. In your own words explain the term interpolation: Give three examples of isolines with their definitions (example: isohyet = line of equal precipitation): 1. 2. 3. Fill in the blank: It is important to ___________ an isoline, particularly if it runs off the page. True or False (circle one): Intervals between isolines on the same map can vary. True or False (circle one): Isolines always branch or split. True or False (circle one): An index contour is shaded darker or heavier than the other contour lines. True or False (circle one): When isolines are very close to one another it indicates a steep gradient (For example, rapid temperature change). Isoline Mapping and Oklahoma Elevation 5