Download
1 / 2
20 likes | 26 Views
Small multiples is one of the most powerful data visualisation techniques for reports and dashboards.<br><br><br>You've probably had to compare several types of data at some time in your career, no matter what industry you work in.<br><br>Cost centres, accounts, sales locations, sales channels, regions, car types, and web traffic referrers are just some of the things you can be dealing with. When working with several kinds of data, you don't need complicated or time-consuming methods that require multiple pages or difficult-to-read tables.

E N D
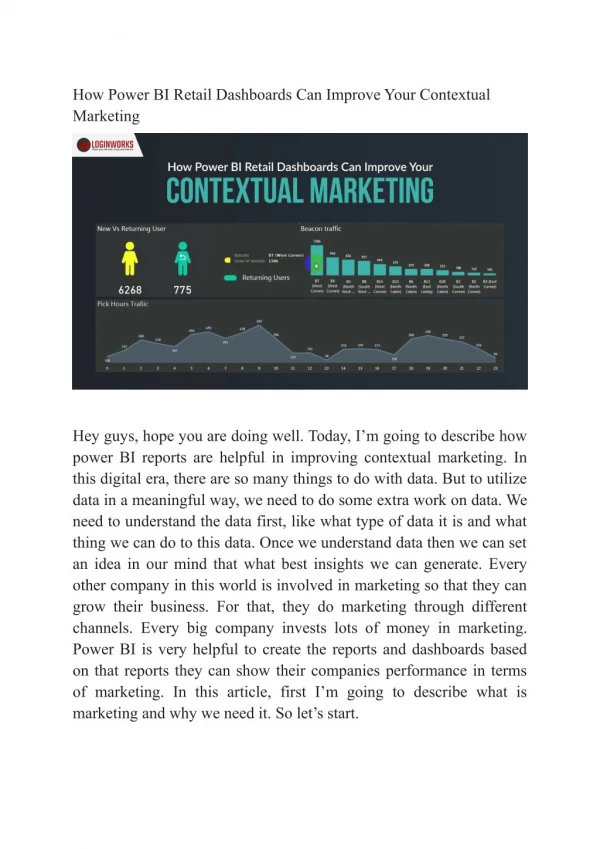
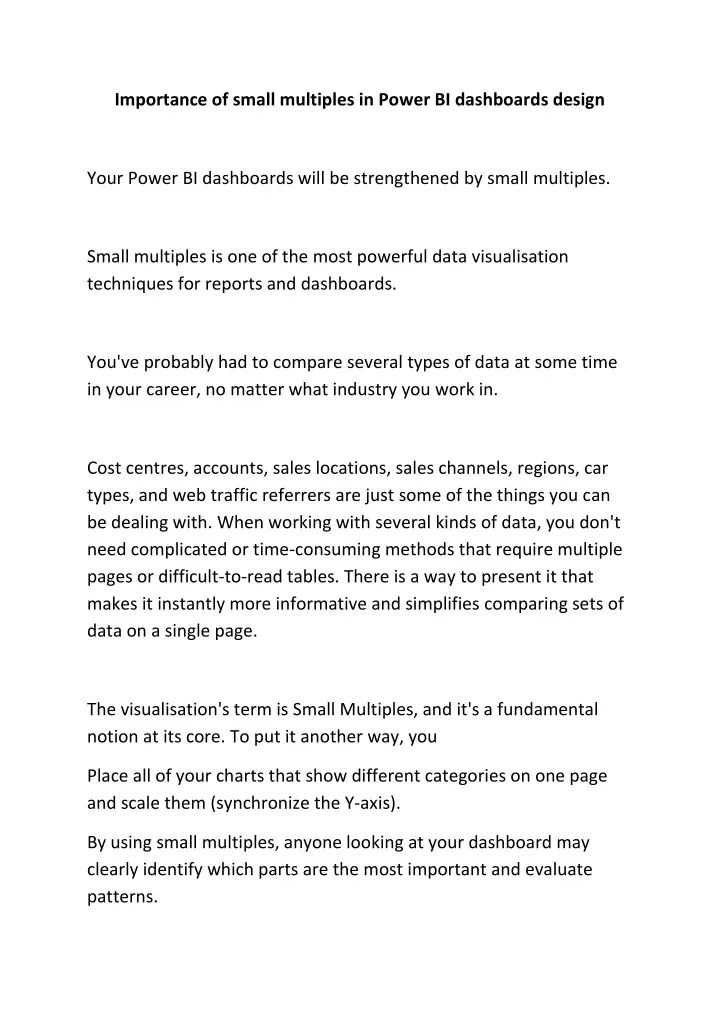
Importance of small multiples in Power BI dashboards design Your Power BI dashboards will be strengthened by small multiples. Small multiples is one of the most powerful data visualisation techniques for reports and dashboards. You've probably had to compare several types of data at some time in your career, no matter what industry you work in. Cost centres, accounts, sales locations, sales channels, regions, car types, and web traffic referrers are just some of the things you can be dealing with. When working with several kinds of data, you don't need complicated or time-consuming methods that require multiple pages or difficult-to-read tables. There is a way to present it that makes it instantly more informative and simplifies comparing sets of data on a single page. The visualisation's term is Small Multiples, and it's a fundamental notion at its core. To put it another way, you Place all of your charts that show different categories on one page and scale them (synchronize the Y-axis). By using small multiples, anyone looking at your dashboard may clearly identify which parts are the most important and evaluate patterns.
Examples of small multiples in Power BI 1.On-time product delivery. You can focus on making your data more meaningful after you've gathered all of your data on a single screen. By combining a line and an area chart, the Hills and Valleys Chart, for example, emphasises the positive and negative variations in relation to the goal. 2.Retail sales by category. 3.Several key performance indicators. We used to work with small multiples that represented a particular KPI, like market share or sales category. Small multiples in this form are the most fundamental. The data is simply replicated over and over for all categories. For more info please visit @ https://www.pbivizedit.com/