Download
1 / 43
430 likes | 753 Views
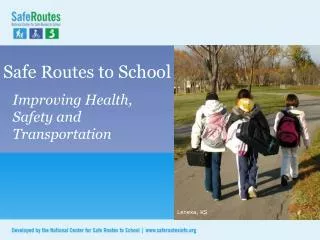
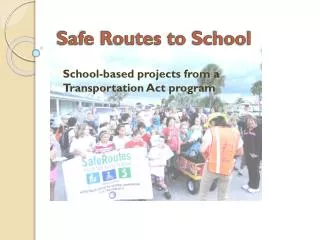
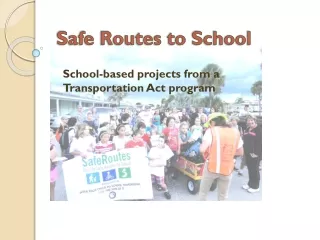
Safe Routes to School. Improving Health, Safety and Transportation. Madison, WI. The need for Safe Routes to School. Fewer kids today walk and bike to school Unintended consequences have resulted SRTS programs are part of the solution.

E N D
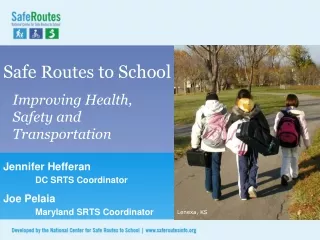
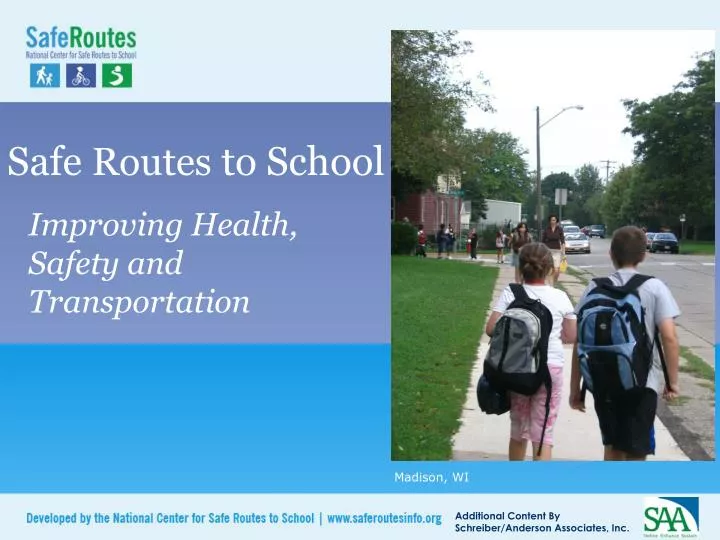
Safe Routes to School Improving Health, Safety and Transportation Madison, WI
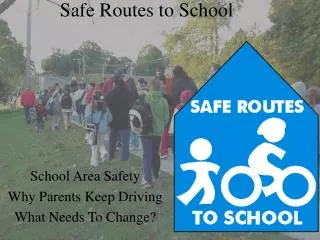
The need for Safe Routes to School • Fewer kids today walk and bike to school • Unintended consequences have resulted • SRTS programs are part of the solution
1. Fewer kids are biking and walking. More parents are driving. • 2001: 16% walked • 1969: 42% walked (CDC, 2005)
Parents driving Parents driving children to school: 20%-25% of morning traffic (NHTSA 2003; Dept. of Environment)
School siting issues: A generation ago • Small schools • Located in community centers (EPA, 2003) Madison, WI
School siting issues: Today • Mega-schools • Built on edges of towns and cities
School consolidation has lengthened the trip between home and school
It’s not just distance Students who live within 1 mile and walk or bike: 2001: 63% 1969: 87% (CDC, 2005) Madison, WI
Most common barriers to walking and bicycling to school • Long distances 62% • Traffic speeds/volume 30% • Adverse weather 19% • Fear of crime/danger 12% Note: Sum of percentages is more than 100% because respondents could identify more than one barrier. (CDC, 2005)
Traffic danger Milwaukee, WI Middleton, WI
Adverse weather Centreville, VA Howard’s Grove, WI
Individual community issues • Fear of crime (both real and perceived) • Abandoned buildings • Other reasons
2. The unintended consequences of less walking and bicycling • On the environment • On individual health
1996 Summer Olympic Games banned single occupant cars in downtown Atlanta Atlanta, GA
Results of the ban • Morning traffic – ä 23% • Peak ozone – ä 28% • Asthma-related events for kids – ä 42% (Journal of the American Medical Association [JAMA], 2001)
Engine Idling • Reduces air quality • Idling an engine produces 2X exhaust emissions as an engine in motion • Increases air pollution around the school right at the time when children are present • 10 seconds of idling wastes more fuel than restarting the engine • Wastes money Madison, WI
Air quality Measurably better around schools with more walkers and bicyclists (EPA, 2003) Chicago, IL
Physical inactivity • Most kids aren’t getting the physical activity they need • Recommended 60 minutes on most, preferably all, days of the week (US Depts. of Health and Human Services and Agriculture, 2005)
Overweight children have an increased risk of… • Type 2 Diabetes • Low self esteem • Decreased physical functioning • Obesity in adulthood • Many other negative emotional & physical effects (Institute of Medicine, 2005)
Good news! Communities are taking action on behalf of children through Safe Routes to School Winston-Salem, NC Alhambra, CA Phoenix, AZ
3. Safe Routes to School programs are part of the solution… ...to improve walking and bicycling conditions ...to increase physical activity ...to decrease air pollution Dallas, TX
More benefits of SRTS programs • Reduce congestion around schools • Can lead to cost savings for schools(reduce need for “hazard” busing) • Others: increase child’s sense of freedom, help establish lifetime habits, teach pedestrian and bicyclist skills
Elements of SRTS programs • Education • Encouragement • Enforcement • Engineering • Evaluation Madison, WI
Education • Imparts safety skills • Creates safety awareness • Fosters life-long safety habits • Includes parents, neighbors and other drivers Chicago, IL
Encouragement • Increases popularity of walking and bicycling • Is an easy way to start SRTS programs • Emphasizes fun Elmhurst, IL
Enforcement • Increases awareness of pedestrians and bicyclists • Improves driver behavior • Helps children follow traffic rules Richmond, VA Denver, CO
Engineering • Creates safer conditions for walking and bicycling • Can influence the way people behave West Valley City, UT
Evaluation Is the program making a difference?
Federal Safe Routes to School program • $612 million to States 2005-2009 • Funds infrastructure and non-infrastructure activities • Requires State SRTS Coordinators More information: www.saferoutesinfo.org
Wisconsin’s program Renee CallawaySRTS Program ManagerWisconsin Department of TransportationPO Box 7913, Madison, WI 53707-7913Phone: (608) 266-3973Fax: (608) 266-0658Email: renee.callaway@dot.state.wi.us
Safe Routes to School goals • Where it’s safe, get children walking and biking • Where it’s not safe, make changes Green Bay, WI Winston-Salem, NC
Your Safe Routes to School Plan • Your Safe Routes to School Plan will contain the following chapters: • Executive Summary • Introduction to SRTS • Present Conditions and Past Studies • Safety Issues and Routes • Study Recommendations • Developing a School Campaign
Timeline • 2007 • September: Meeting #1; data collection • September/October: Walking and Biking Audits; Distribute and Collect Surveys • October: Continue Walk/Bike Audits; Continue to Collect Surveys • November: Surveys Compiled; Meeting #2; Develop Alternatives • December: Develop Alternatives
Timeline… • 2008 • January: Develop Alternatives; Meeting #3; Start to Assemble Draft Plan • February: Assemble Draft Plans • March: Meeting #4; Finalize Document • April: Finalize Documents; Delivery Safe Routes to School: Practice and Promise (2004)
SRTS Audit • Purpose • To assess the conditions of a ½ mile radius around each school as they relate to biking and walking • Will help determine the recommendations in the plan • Can be used to apply for infrastructure grants in 2008 • Grant requirement • Volunteers needed!
SRTS Audit Team • Jack Hirt • Executive Director of Bicycle Federation of WI • Involved in Safe Routes to School planning and implementation since 2004 • Abilities include classroom instruction of bicycle and pedestrian safety, and facility design and planning for specific school sites • Year-round bike and walk commuter
SRTS Audit Team • Jessica Wineberg • She currently bikes to work everyday at the Bicycle Federation of WI • She runs the largest Safe Routes to School program in the state with the Milwaukee Public Schools • She is a League Cycling Instructor
SRTS Audit Team • Charley Weeth • Executive Director of Wisconsin Walks • Years of experience with pedestrian safety and access issues • Avid walker and bicyclist, routinely out and about with his German Shepherds
Success! • The success of the plan depends on you • Talk to your neighbors and friends • Participate in the School Campaign • Call your local papers • Envision success! Madison WI
www.saferoutesinfo.org Websites http://www.dot.wisconsin.gov/localgov/aid/saferoutes.htm • Additional Information from the Wisconsin DOT includes:ApplicationsToolkitSurveysContactsLinks to additional information
Websites http://www.saa-madison.com • Additional Information from Schreiber/Anderson Associates includes:Introductory PacketSurveysContactsProject progress