Download
1 / 25
250 likes | 404 Views
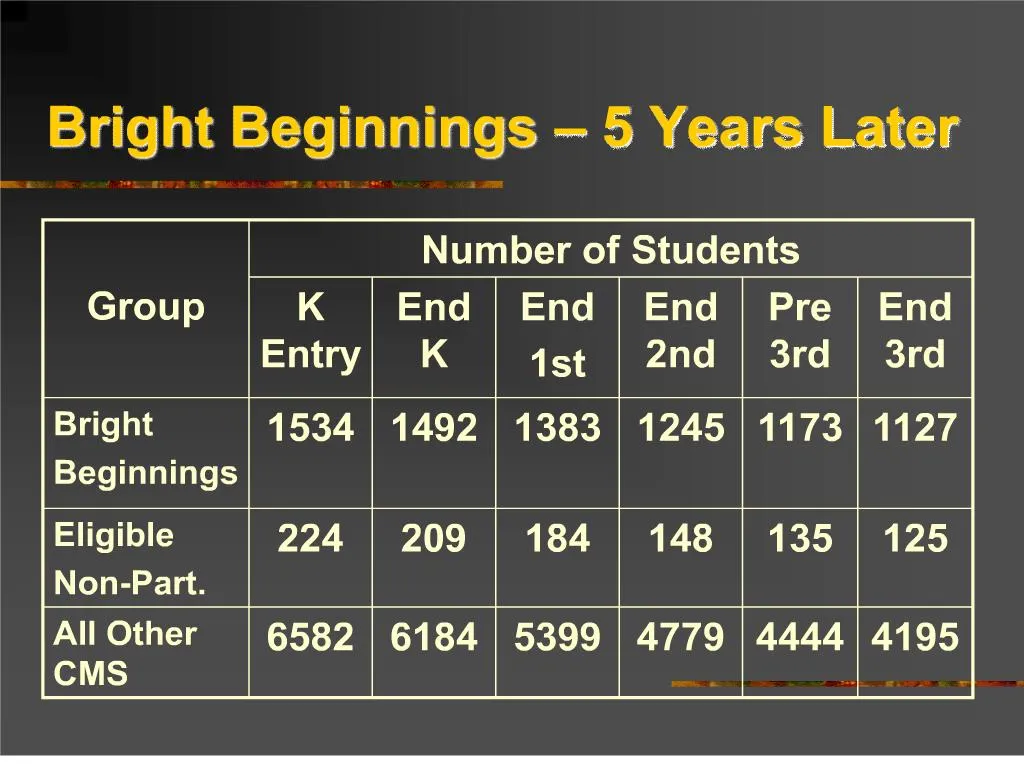
Demographic Groups. After five years, a lower percentage of the original Bright Beginnings group (Cohort 1) has left the cohort compared to Eligible Non-Participants and All Other CMS.% remaining in group after beginning kindergarten:74% Bright Beginnings56% Eligible Non-Participants64% All Other CMSSimilar decreases for African-American students and for Free/Reduced Price Lunch students were found..

E N D
1. Bright Beginnings � 5 Years Later
2. Demographic Groups After five years, a lower percentage of the original Bright Beginnings group (Cohort 1) has left the cohort compared to Eligible Non-Participants and All Other CMS.
% remaining in group after beginning kindergarten:
74% Bright Beginnings
56% Eligible Non-Participants
64% All Other CMS
Similar decreases for African-American students and for Free/Reduced Price Lunch students were found.
3. Demographic Groups
4. Retentions in Grade For each of 3 years, the percentage of Bright Beginnings students retained was lower than the percentage for Eligible Non-Participants.
In grades 1 and 2, a higher percentage of Bright Beginnings students were retained than All Other CMS.
5. Retentions in Grade African-American Students:
For each of three years, a smaller percentage of Bright Beginnings students were retained in grade than Eligible Non-Participants and All Other CMS.
For kindergarten the percentage for Bright Beginnings was half the percentage for the other two groups.
6. Retentions in Grade Free/Reduced Price Lunch Students:
For each of three years, a smaller percentage of Bright Beginnings students were retained in grade than Eligible Non-Participants and All Other CMS.
For kindergarten and grade 1, the percentage for Bright Beginnings was about half the percentage for the Eligible Non-participants.
7. End-of-Grade 3: Reading
8. End-of-Grade 3: Reading Comparing students who remained in Cohort 1 for 5 years shows that:
The percentage of students at or above grade level is about the same for Bright Beginnings students and Eligible Non-participants, but lower than the percentage for All Other CMS.
A higher percentage of Bright Beginnings students performed at level IV than Eligible Non-participants.
The percentage of Bright Beginnings students performing at level IV was less than half the percentage of ALL Other CMS students.
9. End-of-Grade 3: Reading
10. End-of-Grade 3: Reading Comparing African-American students who remained in Cohort 1 for 5 years shows that:
A lower percentage of Bright Beginnings students performed at or above grade level compared to their Eligible Non-participants and All Other CMS peers.
A higher percentage of Bright Beginnings students achieved at level IV than Eligible Non-participants.
A lower percentage of Bright Beginnings students achieved at level IV than All Other CMS students.
11. End-of-Grade 3: Reading
12. End-of-Grade 3: Reading Comparing Free/Reduced Price Lunch students who remained in Cohort 1 for 5 years shows that:
A lower percentage of Bright Beginnings students performed at or above grade level compared to their Eligible Non-participant peers.
A higher percentage of Bright Beginnings students performed at or above grade level compared to their All Other CMS peers.
The percentage of Bright Beginnings students at level IV was double the percentage at level IV for Eligible Non-participants and about the same as the percentage of All Other CMS students.
13. End-of-Grade 3: Mathematics
14. End-of-Grade 3: Mathematics Comparing students who remained in Cohort 1 for 5 years shows that:
The percentage of students at or above grade level is higher for Bright Beginnings students than for Eligible Non-participants.
The percentage of students at or above grade level is lower for Bright Beginnings students than for All Other CMS students.
The percentage of Bright Beginnings students performing at level IV is about the same as the percent for Eligible Non-participants, but about one third the percent of ALL Other CMS students.
15. End-of-Grade 3: Mathematics
16. End-of-Grade 3: Mathematics Comparing African-American students who remained in Cohort 1 for 5 years shows that:
The percentage of Bright Beginnings students performing at or above grade level was higher than the percentage of Eligible Non-participants, but lower than the percentage of All Other CMS students.
The percentage of Bright Beginnings students performing in level IV was higher than the percentage of Eligible Non-participants, but lower than the percentage of All Other CMS students.
17. End-of-Grade 3: Mathematics
18. End-of-Grade 3: Mathematics Comparing Free/Reduced Price Lunch students who remained in Cohort 1 for 5 years shows that:
A higher percentage of Bright Beginnings students achieved at or above grade level than their Eligible Non-participant and All Other CMS peers.
The percentage of Bright Beginnings students performing at level IV was higher than the percentage of Eligible Non-participants, but lower than the percentage of ALL Other CMS students.
19. Bright Beginnings � Another View It is difficult to compare performance of three groups of students when a significant number are no longer present after 5 years. We cannot account for students no longer in CMS, but we can consider those who were retained. One way to do this is to count all retained students for the three groups as �below grade level.� The table below shows the percent of end-of-grade 3 students at or above grade level when retained students are counted.
20. Bright Beginnings � Another View
21. Bright Beginnings � Conclusions As a result of participating in the Bright Beginnings program, educationally needy students:
Are better prepared to begin formal schooling than similar non-participants.
Are more likely to be promoted at the end of kindergarten, grade 1 and grade 2.
Are more likely to achieve at higher levels of performance.
Will continue to benefit from the lasting effects of the program.
22. Bright Beginnings � Conclusions Program results indicate that:
Educationally needy children can learn to high levels.
Early intervention in a literacy-based program improves both reading and math performance.
The achievement gap among children from different racial backgrounds and from families with different levels of income can be narrowed.
23. Bright Beginnings � The Future To increase student learning, continuing program improvements have occurred.
The curriculum was revised in year two to include a greater emphasis on phonemic awareness.
The curriculum was revised in year four to improve phonemic awareness, oral language, and writing.
The assessment was revised in year five to align to the curriculum changes.
An outside evaluation of the program was conducted in 2002, which validated the program and which indicated some areas where additional improvements can be made.
24. Bright Beginnings � A Reminder Bright Beginnings is designed as an intervention for educationally needy children.
Each year, CMS has improved its ability to identify the educationally neediest children, which leads to greater educational challenges faced by the program. Despite these challenges, the program continues to demonstrate success with these students.
Even after Bright Beginnings, these students remain at risk and additional interventions must be provided.
25. Bright Beginnings � A Reminder CMS continues its efforts to serve these children and all at-risk children in the district.
Open Court
EquityPlus II
A+
Personal Education Plans (PEP)
Identified interventions and intensive care
Extended day, week, and year programs
Identification of level I and II students at the beginning of each year