1 / 6

IJsverkoop

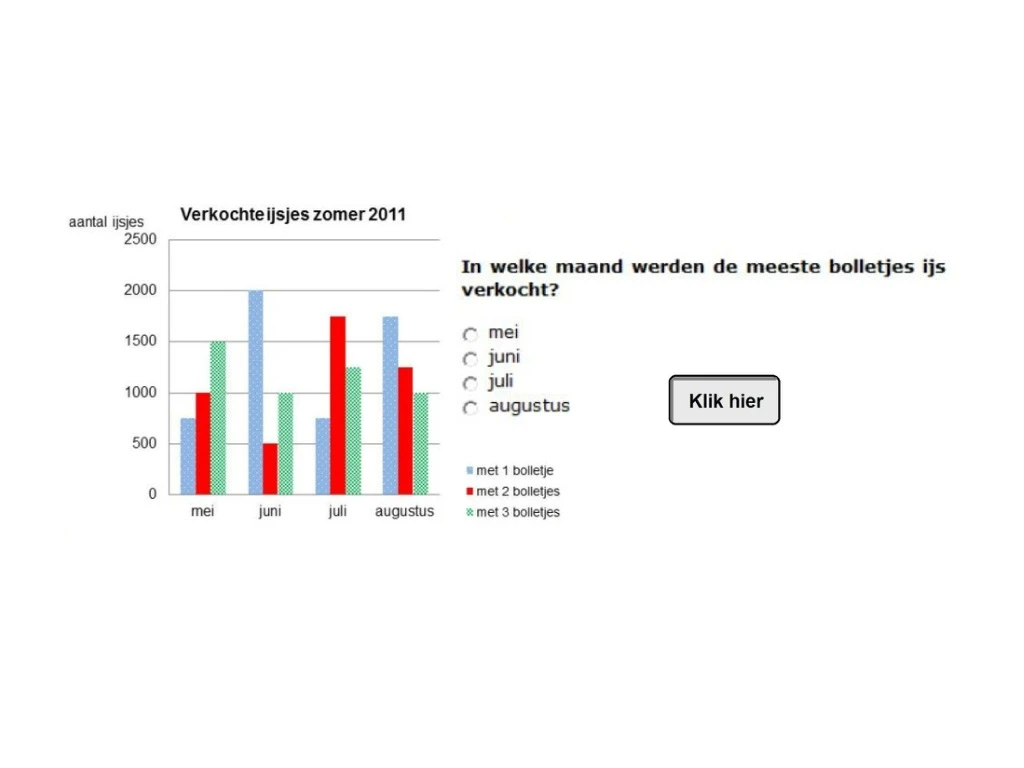
Er worden ijsjes met verschillend aantal bolletjes verkocht. Uit diagram berekenen wanneer de meeste bolletjes zijn verkocht.

Ray2000
Download Presentation

IJsverkoop

An Image/Link below is provided (as is) to download presentation Download Policy: Content on the Website is provided to you AS IS for your information and personal use and may not be sold / licensed / shared on other websites without getting consent from its author. Content is provided to you AS IS for your information and personal use only. Download presentation by click this link. While downloading, if for some reason you are not able to download a presentation, the publisher may have deleted the file from their server. During download, if you can't get a presentation, the file might be deleted by the publisher.

E N D

Presentation Transcript


  1. Hoe los ik deze opgave op? Stap 1. Wat is het einddoel van de opgave? Totaal aantal bolletjes per maand bepalen.

  2. mei: 7250 Stap 2.Aantal bolletjes in mei:

  3. mei: 7250 Juni: 6000 Stap 3. Aantal bolletjes in juni:

  4. mei: 7250 Juni: 6000 Juli: 8000 Stap 4. Aantal bolletjes in juli:

  5. mei: 7250 Juni: 6000 Juli: 8000 aug: 7250 Stap 5. Aantal bolletjes in augustus:

  6. mei: 7250 . Juni: 6000 Juli: 8000 aug: 7250 Stap 6. Vergelijken: in welke maand de meeste bolletjes? Juli: 8000 Meeste bolletjes verkocht.

More Related