Download
1 / 57
570 likes | 847 Views
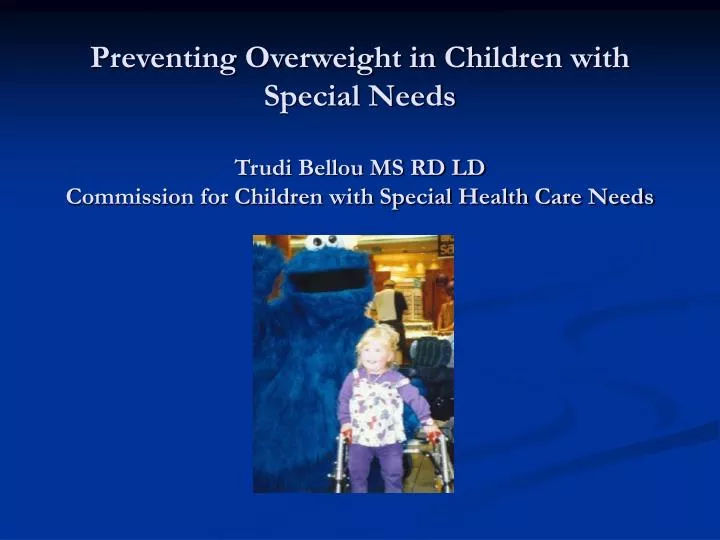
Preventing Overweight in Children with Special Needs Trudi Bellou MS RD LD Commission for Children with Special Health Care Needs. Overweight Increasing in U.S. Children. Year %Overweight 6-11Year Olds 1963-l970 04%

E N D
Preventing Overweight in Children with Special NeedsTrudi Bellou MS RD LDCommission for Children with Special Health Care Needs
Overweight Increasing in U.S. Children Year %Overweight 6-11Year Olds 1963-l970 04% 1976-1980 07% 1988-1994 11% 1999 12% Troiano, R and Flegal, KM, Overweight children and adolescents: Description, epidemiology, and demographics. Pediatrics 1998; 101(3): 497-504
Increase in Childhood Overweight 1999-2004 • 2-5 year olds: ↑ from 7.2-13.9% (+ 6.7%) • 6-11 year olds ↑ from 11-19% (+8%) • 12-19 year olds ↑ from 11-17% (+6%) Source: www.cdc.gov/nchs/products/pubs/hestats/overweight/overwght_child.. Prevalence of Overweight Among Children and Adolescents: United States, 2003-2004
How Prevalent is Overweight in Children With Special Needs? • Bandini et al analyzed data from the National Health and Nutrition Examination Survey from 1999-2002 and found that children with limitations in physical actvity and girls with learning disabilities were more likely to be overweight or at risk of overweight. Bandini LG, Curtin C, Hamad C, Tybor DJ, Must A. Journal of Pediatrics. 2005; 146 (6): 738-43
Children With Intellectual Disabilities • Murphy et al compared BMI’s of 110 children with ID and 107 without ID between 11 months and 20 years of age and found no significant difference in BMI. In another study of 20 children with ID, they found no significant difference in BMI or skinfolds with reference data from NHANES II. Murphy CM,Allison DB, Babbitt RL, Patterson HL. International Journal of Obesity Related Metabolic Disorders. 1992. Sep;16 (9): 633-8
Children With ADHD or Autism Curtin et al calculated BMI’s from medical records of children 3-18 years of age with ADHD and with autism spectrum disorders. The prevalence of overweight or at risk for overweight was similar to the typical population of children for each diagnosis. Curtin C, Bandini LG, Perrin EC, Tybor DJ, Must A. 2005. Pediatrics; 5:48
How Prevalent is Overweight in Adults With Disabilities? • Data from the National Health Interview Survery showed that 34.6% of persons with I.D. were obese in the 1997-2000 periods compared with 30.6% of persons without I.D. • The proportion of obese adults with I.D. increased from 29.4% to 34.6 percent from 1985-1988 to the 1997-2000 study periods.
Adults with I.D. • A review of medical records of adults with I.D. attending a specialty medical practice in New York City by Sohler, Levy, Lubetkin, Soghomonian, and Botuck found that 41.9% were obese and 27.4% were overweight. A total of 63.9% were either overweight or obese compared with 53% in the general population. • Persons with psychiatric disorders in addition to I.D were more likely to be overweight or obese(75.2%). Persons with a seizure disorder in addition to I.D. were slightly less likely to be overweight or obese (63.3%) but still more likely than the general population. Sohler N, Levy J, Lubetkin E, Soghomonian C, Botuck S. Paper presented at the 134th Annual Meeting & Exposition (November 4-8, 2006) of the American Public Health Association, Boston, MA
Adults With Down Syndrome Study by Bell and Bhate: • 70.58% of males and 95.82% of females with Down syndrome were either overweight or obese • 49.29% of males and 62.96% of females with intellectual disabilities due to other causes were either overweight or obese. • 40% of males and 32% of females in the general population in Northumberland, England were overweight or obese. Bell AJ, Bhate MS. 1992. Journal of Intellectual Disability Research; 36(4):359-64
Adults With Physical & Intellectual Disabilities • A telephone survey of adults in Kentucky usng the Behavioral Risk Surveillance Questionnaire found that 35% of persons reporting either a physical or intellectual disability were overweight or obese compared with 21.8% of persons without a disability.
Why Are Children With Special Needs At Risk For Overweight? • Differences in body composition (muscle mass vs fat mass) • Lack of physical activity • Medications that increase appetite • Parents may be over-permissive or over-restrictive regarding food and exercise • U.S. lifestyle—media messages telling us to increase consumption of calorie dense foods, labor saving devices
Differences in Muscle Tone • Hypotonia (low muscle tone, floppiness) • Results in a lower resistance to muscle movement. The lower the resistance, the fewer calories burned during movement. Children with low muscle tone may also have more difficulty initiating movements against gravity. • Hypertonia (high muscle tone, spasticity) • Both types of muscle tone may lower caloric needs by limiting muscle movement. Lack of movement results in muscle atrophy and a lower lean body mass, which in turn reduces the number of calories burned even at rest.
Differences in Muscle Tone • Touwen found that 11% of 6 year old children born full term but SGA and 11% of children born premature and AGA had hypotonia without any other neurological dysfunction. Touwen BC, Hadders-Algra M, Huisjes HJ. Early Human Development. 1998; 17:79-88
Differences in Body Composition • Hediger et al also analyzed NHANES III data on 3-6 year old children born SGA and compared with reference data. • Results showed that children born small for gestational age were lighter, shorter, with smaller arm circumferences but normal arm fatness except for the 6 year old group. Hediger ML, Overpeck MD, McGlynn A, Kuczmarski RJ, Maurer KR, Davis WW. Growth and fatness at three to six years of age of chidlren born small-or large-for gestational age. Pediatrics. 1999;104:33
Differences in Body Composition • Children born prematurely have a lower lean body mass up to 47 months after birth. • Hediger et al found that the arm muscle mass of children born small for gestational age is lower than that of term born children from 2-47 months of age with no significant difference in arm fatness measures in spite of lighter weights. Hediger M, Overpeck M, Kuczmarski R, McGlynn A, Maurer K, Davis W. Pediatrics. 1998;102(5):E60
Differences in Body Composition • Children born prematurely and those born small for gestational age both have more abdominal fatness as teens and adults than children born at term with normal birth weights. • Children born prematurely and those born small for gestational age have a higher risk for high blood pressure and type II diabetes as adults than those born at term with appropriate weights for gestation.
Differences in Body Composition • Eiholzer et al measured skinfolds of 10 young underweight and 13 older overweight children with Prader Willi Syndrome. • Underweight children as well as the overweight children had high skinfold scores relative to their body mass index, showing that body fatness may be high even when children with Prader Willi are underweight by body mass index percentile on the growth chart. Eiholzer U, Blum WF, Molinar L. Journal of Pediatrics. 1999;134(2):222-5
Differences in Body Composition • Spina Bifida: • Mita et al measured body fat of 35 Japanese children with spina bifida and 129 control children with underwater weighing and skinfold thicknesses. No difference between children with spina bifida and controls were found in children below age 5 but children above age 6 had a higher percentage of body fat than controls. Hydrocephalus was highly correlated with body fat. Mita K, Akataki K, Itoh K, Ono Y, Ishida N, Oki T. 1993. Developmental Medicine and Child Neurology; 35(4): 305-11
Differences in Body Compostion • Shepherd et al measured body water, body fat, and lean body mass of 59 children and adults ages 4 months to 29 years with myelomeningocele. They found that body fatness and lean body mass were within normal limits until age 3-4 yr. After this age, body fatness was higher than expected and lean body mass was lower than expected. Shepherd K, Roberts D, Golding S, Thomas BJ, Shepherd RW. 1991. American Journal of Clinical Nutrition; 53(1): 1-6
Differences in Body Composition • Liusuwan et al measured lean body mass, percent body fat and resting metabolic rate of children with spinal cord injury and controls. • Children with SCI had 9.1kg less lean body mass and 6.2% more body fat than controls even though mean BMI of children with SCI was lower (18.9 vs 21.2) than controls. Liusuwan A, Widman L, Abrescer RT, McDonald CN. 2004. Journal of Spinal Cord Medicine;27 Supple 1:S24-8
Lack of Physical Activity • Children with special needs may have fewer opportunities for physical activity because of a need for constant supervision or for adaptive equipment. • Children who are unable to walk burn fewer calories than those who walk. • Children who walk with braces and crutches or walkers actually burn more calories than typical children during actual periods of walking.
Over-Permissive or Over-Restrictive Parenting • Parents may try to compensate their child for his/her medical or physical problem by allowing whatever they want to eat. • Parents may be afraid to allow their child to do things for him/herself because of seizures, asthma. • Parents may be confused about how and when to set limits for a child with physical or mental disabilities.
Medications That May Increase The Appetite • Anticonvulsant medications: Depakene • Anti-inflammatory medications: • Prednisone, Naprosyn, Tolectin • Antidepressant/antipsychotic medications: • Melloril, Valium, Zyprexa, Seroquel, Risperdol, Clozapine • Antihistamine: • Periactin • Hormones: Birth control pills, Depoprovera, Megace, growth hormone
What Are the Consequences of Overweight for the Child with Special Needs?
Overweight Affects Quality of Life and Self Esteem • Research has shown that overweight children are more likely to be teased and to be targets of bullies. • Research on Health Related Quality of Life and children with developmental disabilities has shown progressive decreases in quality of life scores as BMI’s rise.* • Overweight may lower self esteem by interfering with independence. *Williams J, Wake M, Hesketh K, Maher E, Waters E. Health Related Quality of Life of Overweight and Obese Children. JAMA. 2005; 293: 70-76
Overweight Promotes Dependence Overweight reduces mobility by: • Causing braces and prostheses to be quickly outgrown • Causing a need for larger and heavier braces or wheelchairs with wider wheel bases
Overweight Becomes An AdditionalDisability • Overweight Interferes with self care : • Dressing oneself becomes difficult or impossible • It’s hard to tie shoes • Transfers from wheelchairs become much more difficult • Catheterizing oneself or using the restroom by oneself may be impossible
Obesity Results in Health Risks and Complications Increased risk of : • High blood pressure • Heart disease • Arteriosclerosis • Diabetes • Post surgical complications • Pressure sores • Joint problems (foot, knee and hip) • Blount’s disease • Fatty liver disease • Sleep apnea
Consequences of Overweight • Cardiovascular disease occurs at an earlier age in persons with spinal cord disease. • Persons with spinal cord injuries are more likely to have insulin resistance, abnormal glucose tolerance tests, high LDL cholesterol and low HDL cholesterol levels. Bauman WA, Spungen AM. 2001. Journal of Spinal Cord Medicine; 24(4): 266-77
Children With Certain Medical Conditions • Spina bifida(myelomeningocele) • Down Syndrome • Prader-Willi Syndrome • Osteogenesis Imperfecta • Overgrowth Syndromes—Beckwith Wiedemann Syndrome, Simpson Golabi Behmel Syndrome • Some types of dwarfism • Craniopharyngioma
Children With Limited Mobility • Children using wheelchairs or braces who do not have feeding problems • Children needing to be in cast or immobile after surgery for a long period of time
How Do We Know If A Child Is Overweight? • Weight and length or height are plotted on the CDC standard growth charts to compare with reference data from the National Health and Nutrition Examination Survey (NHANES III). • Weight for length percentile is plotted on the growth chart for children birth to 3 years. A weight for length percentile at or above the 95th percentile is considered overweight.
How Do We Know If A Child Is Overweight? • Body Mass index (BMI) is calculated for children over 2 yr. who are able to stand to be measured. • Body Mass index can then be plotted on the CDC growth chart for the 2-20 year old. • A BMI at or above the 95th percentile indicates overweight. • A BMI at or above the 85th percentile indicates at risk for overweight.
How To Calculate BMI BMI= wt in kg ÷ ht in meters ² or BMI= wt in lb ÷ ht in inches² X 703 OK135S053
Children With Abnormal Weight Gain Relative To Height • Infants who are gaining over 1 lb. per month after the 1st 3 months of life • Children who are gaining over 2-3 lb. every 6 months • Children whose weight for length percentile or body mass index is at or above the 85th percentile on the CDC growth charts. • Children whose body mass index percentile is rising prior to the age of 5 years (age of adipose tissue rebound).
Other Ways Of Detecting Overweight • Skinfold and circumference measurements: Arm fat area and muscle fat area can be calculated from tricep skinfold and midarm circumference. • Waist circumference percentiles • Bioimpedence analysis • DEXA • Underwater weighing
How To Help The Child With Special Needs Develop Healthy Eating Habits
Let The Child Self Regulate • If healthy foods are served most children will eat according to their metabolic needs. • Remember that some children with special needs will have lower weights and calorie needs due to low muscle mass. • Forcing or trying to persuade children to eat more can interfere with self regulation. • Access to many low nutrient fat and sugar rich foods causes some children to ignore self regulatory messages.
Set A Good Example! • Get the whole family involved in following a healthy lifestyle. • The diet and lifestyle changes that benefit the child also benefit the entire family.
Serve Meals and Snacks at Regular Times • Avoid constant eating or drinking (other than water) between regular meal and snack times. • Cupboards and refrigerators should be off limits to the child except for designated foods allowed. • Encourage family mealtimes as much as possible.
Avoid Being A Short Order Cook • Avoid replacing foods the child refuses to eat with other foods. • If the child refuses to eat, calmly take the food away and have the child wait until the next meal or snack time (at least 1 1/2 hour).
Limit Screen Time Limit TV and computer/video time to 1-2 hours per day.
Provide Physical Activities • Adapt games and playground equipment for the child’s special needs and abilities. • Use community resources for adaptive recreational activities (wheelchair hockey or basketball, horseback riding, Special Olympics, swimming. • Assign jobs suited to the child’s developmental age and abilities.
Resources for Physical Activity • National Center for Physical Activity and Disability website: www.ncpad.org • www.dsusa.org (Disabled Sports USA) • www.blazesports.com • www.wsusa.org (Wheelchair Sports USA) • www.quadrugby.com • www.soky.org (Special Olympics Kentucky)
Include Child in Fun Activities That Do Not Involve Food • Story reading, acting out story • Singing/playing musical instruments • Board games or card games • Arts and crafts • Trips to a farm, zoo, or park • Water fun in wading pool
Activities That Teach Positive Attitudes Toward Food • Let child help with food preparation--pouring, mixing, spreading, measuring. • Talk about different foods: where they come from, different tastes, colors and textures of food. • Have a tasting party to try new foods. • Help child plant a garden. • Let child help shop for fruits and vegetables at the market.