Download
1 / 1
10 likes | 298 Views
Visualization of Spatial Data in Marine Biogeographic Information Systems. Steven Perry and Daphne G. Fautin Department of Ecology and Evolutionary Biology, & Natural History Museum and Biodiversity Research Center. ABSTRACT

E N D
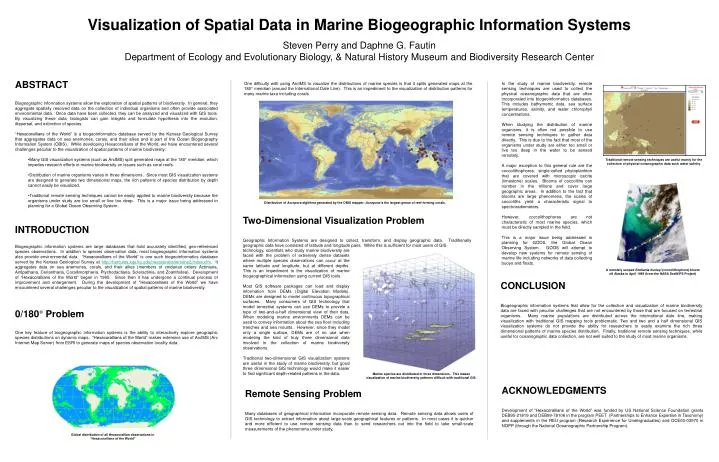
Visualization of Spatial Data in Marine Biogeographic Information Systems Steven Perry and Daphne G. FautinDepartment of Ecology and Evolutionary Biology, & Natural History Museum and Biodiversity Research Center • ABSTRACT • Biogeographic information systems allow the exploration of spatial patterns of biodiversity. In general, they aggregate spatially resolved data on the collection of individual organisms and often provide associated environmental data. Once data have been collected, they can be analyzed and visualized with GIS tools. By visualizing these data, biologists can gain insights and formulate hypothesis into the evolution, dispersal, and extinction of species. • “Hexacorallians of the World” is a biogeoinformatics database served by the Kansas Geological Survey that aggregates data on sea anemones, corals, and their allies and is part of the Ocean Biogeography Information System (OBIS). While developing Hexacorallians of the World, we have encountered several challenges peculiar to the visualization of spatial patterns of marine biodiversity: • Many GIS visualization systems (such as ArcIMS) split generated maps at the 180° meridian, which impedes research efforts in marine biodiversity on issues such as coral reefs. • Distribution of marine organisms varies in three dimensions. Since most GIS visualization systems are designed to generate two dimensional maps, the rich patterns of species distribution by depth cannot easily be visualized. • Traditional remote sensing techniques cannot be easily applied to marine biodiversity because the organisms under study are too small or live too deep. This is a major issue being addressed in planning for a Global Ocean Observing System. • INTRODUCTION • Biogeographic information systems are large databases that hold accurately identified, geo-referenced species observations. In addition to species observation data, most biogeographic information systems also provide environmental data. “Hexacorallians of the World” is one such biogeoinformatics database served by the Kansas Geological Survey at http://hercules.kgs.ku.edu/hexacoral/anemone2/index.cfm. It aggregates data on sea anemones, corals, and their allies (members of cnidarian orders Actiniaria, Antipatharia, Ceriantharia, Corallimorpharia, Ptychodactiaria, Scleractinia, and Zoanthidea). Development of “Hexacorallians of the World” began in 1995. Since then it has undergone a continual process of improvement and enlargement. During the development of “Hexacorallians of the World” we have encountered several challenges peculiar to the visualization of spatial patterns of marine biodiversity. • 0/180° Problem • One key feature of biogeographic information systems is the ability to interactively explore geographic species distributions on dynamic maps. “Hexacorallians of the World” makes extensive use of ArcIMS (Arc Internet Map Server) from ESRI to generate maps of species observation locality data. One difficulty with using ArcIMS to visualize the distributions of marine species is that it splits generated maps at the 180° meridian (around the International Date Line). This is an impediment to the visualization of distribution patterns for many marine taxa including corals. In the study of marine biodiversity, remote sensing techniques are used to collect the physical oceanographic data that are often incorporated into biogeoinformatics databases. This includes bathymetric data, sea surface temperatures, salinity, and water chlorophyll concentrations. When studying the distribution of marine organisms, it is often not possible to use remote sensing techniques to gather data directly. This is due to the fact that most of the organisms under study are either too small or live too deep in the water to be sensed remotely. A major exception to this general rule are the coccolithophores, single-celled phytoplankton that are covered with microscopic calcite (limestone) scales. Blooms of coccoliths can number in the trillions and cover large geographic areas. In addition to the fact that blooms are large phenomena, the scales of coccoliths yield a characteristic signal to spectroradiometers. However, coccolithophores are not characteristic of most marine species, which must be directly sampled in the field. This is a major issue being addressed in planning for GOOS, the Global Ocean Observing System. GOOS will attempt to develop new systems for remote sensing of marine life including networks of data collecting buoys and floats. Traditional remote sensing techniques are useful mainly for the collection of physical oceanographic data such water salinity. Distribution of Acropora digitifera generated by the OBIS mapper: Acropora is the largest genus of reef-forming corals. Two-Dimensional Visualization Problem Geographic Information Systems are designed to collect, transform, and display geographic data. Traditionally geographic data have consisted of latitude and longitude pairs. While this is sufficient for most users of GIS technology, scientists who study marine biodiversity are faced with the problem of extremely dense datasets where multiple species observations can occur at the same latitude and longitude, but at different depths. This is an impediment to the visualization of marine biogeographical information using current GIS tools. Most GIS software packages can load and display information from DEMs (Digital Elevation Models). DEMs are designed to model continuous topographical surfaces. Many consumers of GIS technology that model terrestrial systems can use DEMs to provide a type of two-and-a-half dimensional view of their data. When modeling marine environments DEMs can be used to convey information about the sea floor including trenches and sea mounts. However, since they model only a single surface, DEMs are of no use when modeling the kind of truly three dimensional data involved in the collection of marine biodiversity observations. Traditional two-dimensional GIS visualization systems are useful in the study of marine biodiversity, but good three dimensional GIS technology would make it easier to find significant depth-related patterns in the data. A remotely sensed Emiliania huxleyi (coccolithophore) bloomoff Alaska in April 1998 (from the NASA SeaWIFS Project) CONCLUSION Biogeographic information systems that allow for the collection and visualization of marine biodiversity data are faced with peculiar challenges that are not encountered by those that are focused on terrestrial organisms. Many marine populations are distributed across the international date line, making visualization with traditional GIS mapping tools problematic. Two and two and a half dimensional GIS visualization systems do not provide the ability for researchers to easily examine the rich three dimensional patterns of marine species distribution. Finally, traditional remote sensing techniques, while useful for oceanographic data collection, are not well suited to the study of most marine organisms. Marine species are distributed in three dimensions. This makes visualization of marine biodiversity patterns difficult with traditional GIS. ACKNOWLEDGMENTS Development of “Hexacorallians of the World” was funded by US National Science Foundation grants DEB95-21819 and DEB99-78106 in the program PEET (Partnerships to Enhance Expertise in Taxonomy) and supplements in the REU program (Research Experience for Undergraduates) and OCE00-03970 in NOPP (through the National Oceanographic Partnership Program). Remote Sensing Problem Many databases of geographical information incorporate remote sensing data. Remote sensing data allows users of GIS technology to extract information about large-scale geographical features or patterns. In most cases it is quicker and more efficient to use remote sensing data than to send researchers out into the field to take small-scale measurements of the phenomena under study. Global distribution of all Hexacorallian observations in “Hexacorallians of the World”