Download
1 / 2
20 likes | 37 Views
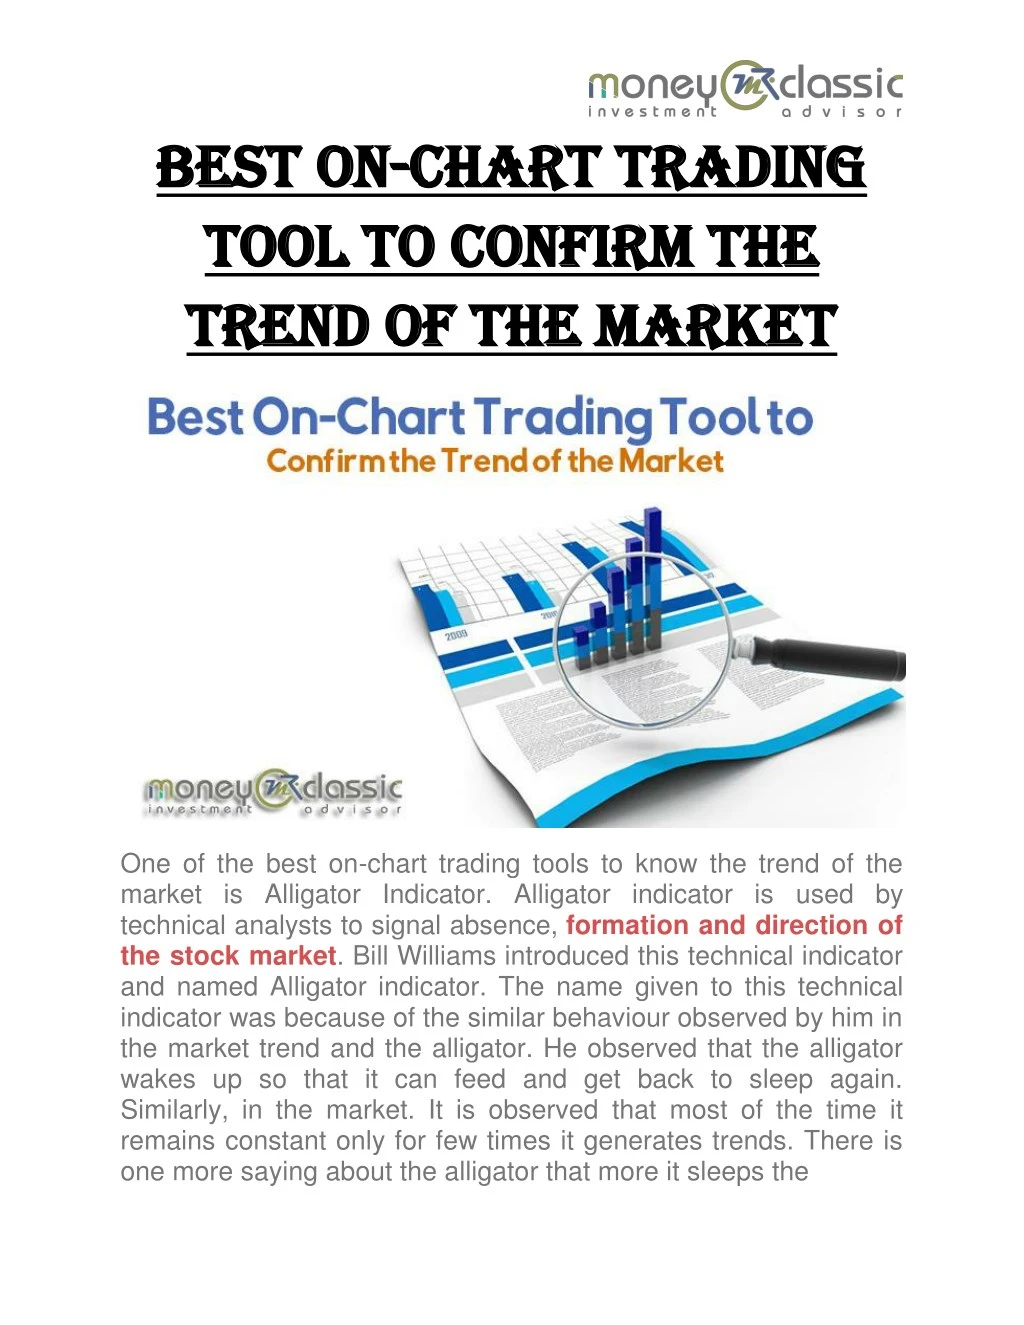
One of the best on-chart trading tools to know the trend of the market is Alligator Indicator. Alligator indicator is used by technical analysts to signal absence, formation and direction of the stock market. Bill Williams introduced this technical indicator and named Alligator indicator.

E N D
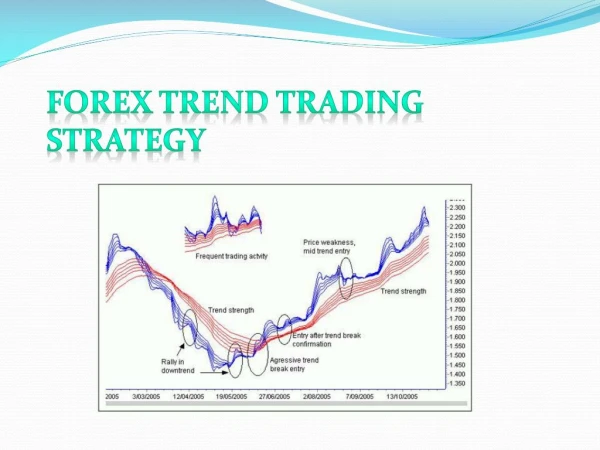
Best On Best On- -Chart Trading Chart Trading Tool to Confirm the Tool to Confirm the Trend of the Market Trend of the Market One of the best on-chart trading tools to know the trend of the market is Alligator Indicator. Alligator indicator is used by technical analysts to signal absence, formation and direction of the stock market. Bill Williams introduced this technical indicator and named Alligator indicator. The name given to this technical indicator was because of the similar behaviour observed by him in the market trend and the alligator. He observed that the alligator wakes up so that it can feed and get back to sleep again. Similarly, in the market. It is observed that most of the time it remains constant only for few times it generates trends. There is one more saying about the alligator that more it sleeps the
hungrier it gets. In concert with this fact, for more time the market is constant, stronger the market move will be. The alligator indicator consists of three periods smoothed moving averages that are moved into the future three respective bars. The three periods considered are 13, 8 and 5 whose smoothed moving average is further moved to bars of 8, 5 and 3 respectively. The colours of these bars are blue, red and green showing the jaw, teeth and lips of the alligator correspondingly. While gazing the indicator, the technical analysts observe that the alligator is resting. When they find the three averages are twisted collectively in a tapered range. It is observed that when the distance between the averages grows to be more than the probability of change in the price of stocks is more. As shown in the figure above. The averages continue to go in the upward direction, which is interpreted by the technical analysts as the signal to buy the stocks. In the illustration, it is shown by the green colour line followed by red and blue. The third and last portion of the chart shows that while the slope is moving down. Then the averages are reversed in order. The blue colour average is followed by the red and green averages, which shows the strong signals of selling. This is signal of a downtrend and technical analysts consider selling the stocks and assets at an occurrence of this point.