Download
1 / 2
20 likes | 33 Views
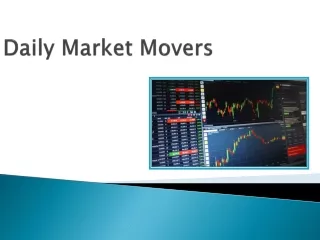
Get access to trade market’s internal health and long-term trends by using market breadth. This is a unique tool developed to help marketers, traders, investors in identifying the new high and low, advance-decline, and the up-down volume of the market trend. Market breadth analysis is 100% live and available at Superior Profit’s YouTube channel. Subscribe to the channel to receive an alert on a new video. No more if or but, start stock trading in confidence. Visit website: https://superiorprofit.co/market-breadth/

E N D
5 Market Breadth Indicators to Improve Your Daily Market Analysis Finding it difficult to understand the real strength & weakness of the market? Well, no matter whether you are a pro or a beginner, it’s always difficult to understand the behavior of the stock market. To avoid any unfortunate loss in investments, you need to play smartly by identifying the market breadth statistics. Market breadth can be interpreted in many ways. You can consider it as the number of stocks involved in a rally or the number of active investors in the current market. Basically, Market Breadth analysis is an advanced technique that indicates the direction of the overall market. Before making investments in the stocks, it is essential to determine whether the market is going up or shrinking down. When more companies are moving higher than the number of companies moving lower, it is termed as positive market breadth. You can quickly analyze the market breadth of stocks using potential breadth indicators. What are market breadth indicators? To understand how the market is doing at present and how it will perform in the future, you need to use market breadth indicators. Practically, breadth indicators ensure you report about a market move, before it happens. You can also learn about the divergences, where the market is moving, and which stocks are participating in the move. Confused about how to measure the market breadth? If you don’t have much technical knowledge about the stock market, you can simply use the breadth components. Some significant market breadth components include New Highs, New Lows, Up Volume, Down Volume, Total Volume, Advances, Declines, Unchanged, and Total issues. With these components, you can effectively study the behavior of market moves through breadth indicators.
Below here, 5 market breadth indicators have been mentioned, which are reliable to improve daily market analysis. SPXA50R - This indicator is excellent for detecting price movement extremes. It shows % of stocks in the S&P, that are above their past 50-day moving average. Cumulative A/D line - The cumulative A/D line is an efficient timing indicator. Instead of studying the regular bar chart, it is effective to use the cumulative A/D line to determine the trend continuation in the market. NYSE A/D line - The NYSE A/D line can give you real-time hints about the turning points and trend days. The readings include only NYSE stocks and clearly indicate whether a trend day is forming or not. McClellan Oscillator - This oscillator indicates about the weighted average of Advancers vs. Decliners. With this, you can quickly identify the extreme market breadth both to the short side and the long side. TICK Charts - This chart-type indicator is highly recommended for short- term timeframes. It shows how many stocks are bought at the ask, and how many are sold at the bid. To know more about market breadth analysis and indicators, you need to consult with the experts. Superior Profit Amin Pte Ltd 10 Anson road #33-4A International Plaza Singapore 079 903 Email – info@superiorProfit.co Phone - +65 8727 5926 Website: https://superiorprofit.co/