Download
1 / 39
490 likes | 1.24k Views
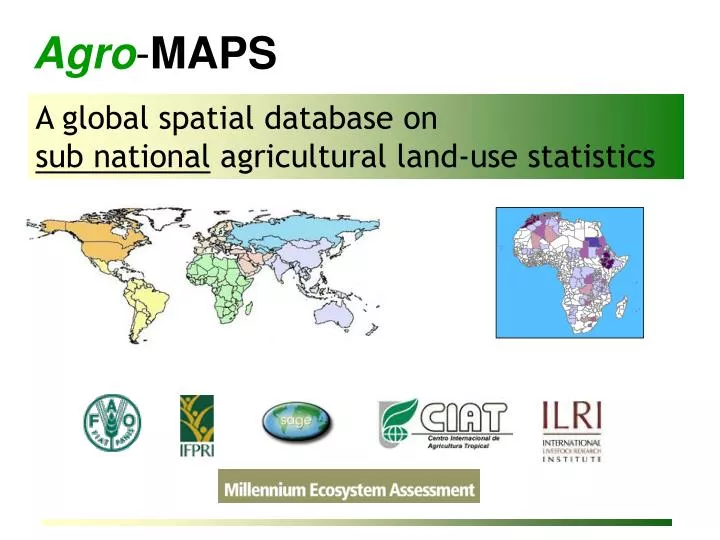
Agro - MAPS. A global spatial database on sub national agricultural land-use statistics. Land use (LU). “..human activities which are directly related to land, making use of its resources or having an impact on it ...” FAO, 1995.

E N D
Agro-MAPS A global spatial database on sub national agricultural land-use statistics
Land use (LU) “..human activities which are directly related to land, making use of its resources or having an impact on it ...”FAO, 1995 • Socio-economic purpose of the activities (functional definition) • Usually multiple purposes • Manipulation of natural ecosystems in order to obtain benefits • Material benefits/ products (e.g. cereals, livestock) • Immaterial benefits/ services (e.g. erosion prevention) • Often some unwanted impacts!! Outputs Management Inputs What is the land used for? production vs. extractive process
Why we need LU information • Land resources are finite & usually scarce! • Competition among various land uses (e.g. urban expansion into agricultural areas) • Different land uses affect the natural equilibrium of ecosystems differently - dissimilar impacts on the sustainable flow of goods & services • Thus, knowledge of current LU (& land resources) is needed for formulating changes leading to sustainable use of the resources LU – Key input for planning & policy formulation • national regional/global scales
Local development issues • Zambia • Cited in NEAP: • Land degradation • Deforestation (Zambia 2.4%/yr – FRA 2000) • Air pollution & acid rain in mining areas • Water pollution & inadequate sanitation • Wildlife (game & fish) depletion • Most recent country wide LU information – 1975 • Focus of ILUA (integrated land use assessment) initiative Source: 2nd Zambian National report to UNCCD
Environmental conventions • The Convention on Wetlands (Ramsar Convention), 1971 • Programs to conserve and use wisely all wetlands; 137 Parties; • Convention on International Trade in Endangered Species of Wild Fauna and Flora, CITES 1975 • To safeguard species from over exploitation; 164 parties; Appropriate wildlife management & trade policies • Convention on Biological Diversity, CBD 1992 • 187 Parties; biodiversity conservation • UN Framework Convention on Climate Change, 1992 • Kyoto Protocol (joint implementation, CDM, emissions trading) • UN Convention to Combat Desertification, UNCCD, 1994 • Programs to reduce degradation of land in arid, semi-arid and dry sub-humid areas; 166 Parties;
Status of available data - 1 Regional/ global data • Crops FAOSTAT; IFPRI • ForestsFAO (FRA) • Water AQUASTAT, U. Kassel • Cultivation intensity NASA • Eco systems USGS • Protected areas UNEP-WCMC • Land cover/use FAO(Africover); USGS; IFPRI; SAGE; LUCC; MA; GLC2000; Global Mapping; Shortcomings: ± limited coverage / number of classes; non-standard definitions; insufficient information on management aspects; insufficient detail; modelled data
Food security & poverty Land degradation Climate change Policy formulation Land use planning Investments in sustainable agriculture .. Status of available data - 2 Insufficient agricultural land use information needed to examine national, regional & global issues TOPICAL ISSUES
Agricultural land use How? Management: inputs, technologies How much? Quantities: areas, products, .. What? Objectives:Products, services When? Timing of operations Where? Location & spatial extent Why? eg. reasons (biophysical, socio-economic,.) Major characteristics of agricultural land use Versus Land cover... the observed (bio)physical cover on the earth’s surface (LCCS, 2000)
Agro-MAPS database contents How much? Quantities: areas, products, .. • Statistics aggregated by sub-national administrative districts. • crop production • area harvested • crop yields What? Objectives:Products,services Where? Location & spatial extent Major contents of the Agro-MAPS database
FAO Contributors to Agro-MAPS SAGE Map source: CGIAR IFPRI • Global data base; subnational; geo-referenced; • Pooled contributions (FAO, IFPRI, SAGE, CIAT, ..)
Compilation - tabular statistics FAO codes area harvested barley production Spelling; name changesredistricting Boundary file codes;SALB Missing; not available; zero; validation vs FAOSTAT • Data from diverse sources; IPR issues • Harmonization; accuracy!!
Compilation of boundaries MALAWI FAO IFPRI • Differences in 2nd level boundaries from different secondary sources • Boundary disputes • Coding scheme
Matching statistics to boundaries Challenge: Find the right map!
Subnational vs national statistics Crop distribution – Maize FAOSTAT Agro-MAPS Statistics aggregated by 57 Countries Statistics aggregated by5690 Administrative units
Status of Agro-MAPS Countries for which data are contained in Agro-MAPS
Agro-MAPS Explorer A tool for browsing the Agro-MAPS database Search & output parametersAdmin1; maize; productionMost recent data; shapefile
On-line query & data access Download data CD-ROM publication:all regions - end 2004 Interactive query & display of maps
Food security & poverty Land degradation Climate change Policy formulation Land use planning Investments in sustainable agriculture .. Potential for expansion of agricultural areas ratio of cultivated to cultivable land Potential for intensification Ratio of harvested to cropland areas Ratio of cultivated land to fallow land agricultural land under irrigation Sustainability arable and permanent cropland area (the cropland area used for food production) (UNCSD indicator) Applications of Agro-MAPS data Indicator analysis – (e.g. monitoring progress - MDG Goals) Goal 1: Eradicate extreme poverty & hunger Goal 7: Ensure environmental sustainability SELECTED INDICATORS from Agro-MAPS TOPICAL ISSUES
Reponses Driving forces Pressures Impacts State Land degradation assessment Macro-economic policiesLand tenure policies Conservation/ rehabilitationEarly warning systemsInvestments Macro-economic policies Growth in population, incomeLand use Land tenure Poverty Natural disasters LADA project Ecosystem Approach Relationships: DPSIRDecision making tool Agro-MAPS data • Poverty & migrationReduction in products & services • Carbon sequestration • Water quality; biodiversity • Habitat destruction • Rising demands • Agriculture sector: products / inputs - over grazing - nutrient mining • Waste disposal
Indicators: pressure • Percentage of agricultural land under exploitation • % of agricultural land used for crops (annual/ permanent) • Agricultural area per crop (cereal, oil crops, forage, woodlands) • Number of hectares of agricultural land per farmer; arable land per capita • Size of agricultural land under irrigation • Ratio of cultivated to cultivable land • Ratio of cultivated land to fallow land • Increase in cropping intensity (harvested areas/total cropland) • Agricultural area (intensely farmed, semi-intensely farmed, and uncultivated) • Increase in percentage irrigated area to cropland area • Percentage of cultivation on open access land, common property and private property • Land use (e.g. cultivated areas) in areas of high erosion potential
Indicators: State • Ratio between actual and estimated crop yields • Land productivity adjusted for input use. • Net nutrient extraction in cropland, pastures, and forests • Number of crops under cultivation (>100ha) (bio-diversity) • Number of rare/minor crops under cultivation (>100ha) (biodiversity) • Area of each crop (biodiversity) • Number of cultivars per crop (biodiversity) • Area of each cultivar in a given year or period (biodiversity) • Crops (livestock) grown as a percentage of number 30 years beforehand • Number of key crop varieties (domestic, non-domestic) • Value of Production (VoP) per hectare of cropland
Indicators - Response • Decentralized local-level NRM involving key stakeholders • Environmental impact statement requirement • Government spending in rural infrastructure (e.g. wells) • Subsidies to agricultural production • NGOs’ programs and actions plans • Number of land titles given • Increased access to non-traditional sources of energy • Percentage of protected areas of different ecosystems • Percentage of rural population having access to extension services • Farmers served by soil conservation programs • Use of techniques for soil improvement/ conservation • Changes in input use/ management practices (fertiliser, irrigation, genetic improvements, conservation agriculture,..); • Increase in access to credit for switching to better management practices • Environmental protection expenditures
Zones at risk to degradation Comparison: • Soil suitability - Results of agro-ecologic studies • Agro-MAPS data on actual land use Agro-MAPS GAEZ Cultivation potential for rain-fed grain maize production (intermediate input level) Améliorer: Répartition selon les zones des cultures au lieu des unités administratives
11. Agro-pastoralmillet/sorghum 7. Root crop Irrigated areas 2. Tree-crop expert opinion, GAEZ,.. Characterization -Farming systems 8. Cereal-root Farming systems & poverty study, 2001 • Appropriate investment strategy? • Expansion; intensification; • Off-farm income; abandon agriculture Agro-MAPS: major crop combinations
Publish data: CD & web Database improvement & Development of applications in partnership with other institutions time series data improved spatial allocation (RS input) ...... Future plans - Agro-MAPS Land and Plant Nutrition Management Service, AGLL Land and Water Development Division FAO http://www.fao.org/landandwater/agll/agromaps/interactive/index.jsp
Land classification • Used as a guide for collecting selected information on land relevant for decision making • policy formulation; environmental monitoring (e. land degradation); ..... • Systematic arrangement ; grouping by similar characteristics • land cover (bio-physical cover) (LCCS-FAO) • land use (purpose: goods & services, inputs, management) • Class definition • ‘a priori’ (before data collection) • standardized classes; rigid • ‘a posteriori’ (cluster after data collection) • could yield non-standardized classes; flexible • hierarchic vs. non hierarchic (different scales!) • Characterization vs. classification
Land cover map using LCCS ... the observed (bio)physical cover on the earth’s surface (LCCS, 2000)
VEGETATED NON-VEGETATED Terrestrial A1 Aquatic or regularlyfloodedland A2 Terrestrial B1 Aquatic or regularlyfloodedland B2 culti-vated A11 natural/semi- natural A12 cultiv- ated A23 natural/semi- natural A24 built up & assoc. areas B15 bare areas B18 arti-ficial water-bodies B27 inland water B28 FAO - LC classification system + more classifiers & optional Attributes • increasing worldwide adoption of LCCS as standard • possible to relate LCCS & UNSD classes (NB. forest thresholds differ – 15 vs. 10%)
A. Life form B. Spatial Aspects C. Crop combination D. Cover relatedcultural practices L. Land form M/N Lith./Soils O Climate P. Altitude Q. Erosion W. Cover S. Crop type FAO Land cover classification system II VEGETATED Terrestrial - A1 Aquatic/reg. flooded land - A2 (semi)natural A12 cultivated A23 (semi)natural A24 cultivated A11 Classifiers Environmental attributes Technical (discipline) attributes
LCCS: Classifiers & attributes –A11 • trees, shrubs, herbaceous,. A. Life form • large, medium, small sized fields • continuous, scattered (clustered, isolated) B. Spatial Aspects C. Crop combination • single, multiple crop • rainfed, post flooding, irrigated,. • shifting cultivation, fallow, permanent D. Cultural practices • level, sloping, steep land; composite landforms L. Land form • igneous, sedimentary, metamorphic • bare rock, soil, loose sands, hard pans; soil group M/N. Lithology /Soils • tropics, sub-tropics, temperate, ... .; LGP O. Climate • <300, 300-1500, 1500-3000, 3000->5000 metres,. P. Altitude • erosion visible, not visible. Q. Erosion • permanent (trees, shrubs); temporary (herbaceous) W. Crop Cover/ density • food/ non-food crops S. Crop type CODE: A11 A1 B2 C1 D1 rainfed trees single crop small-sized
Additional attributes Not adequately covered in LCCS • pest/disease/ weed management • controlled environment management (i.e use not related to inherent land suitability) • use of fertilizer, or other soil amendments • terrain or slope modifications • above and below ground biomass management • drainage management • soil conservation/ cover protection • water treatment/ use management
Harmonizing definitions Predominantly forestry land use Predominant landuse other than forestry LAND USE High tree presence LAND COVER FRA: Trees outside forests UNFCCC/KP: Forest FRA: Forest UNFCCC/KP: Forest FRA: Trees outside forests UNFCCC/KP: optional forest FRA: Forest UNFCCC/KP: optional forest Option zone, KP Threshold FRA FRA: Other wooded land UNFCCC/KP: non-forest FRA: Trees outside forests UNFCCC/KP: non-forest Threshold FRA FRA: Other land without trees UNFCCC/KP: non-forest No trees
Linkages to other statistics FRA 2005 definition (=UNSD) Other wooded land: land under forestry or no land use, spanning more than 0.5 ha; with trees > 5m & a canopy cover of 5-10%, or trees able to reach these thresholds in situ; or with a combined cover of shrubs, bushes & trees over 10% 10% Canopy cover 5% 5 meters 0 Height of trees
Linkages to other statistics FRA 2005 definition (= UNSD) Forest: land under forestry or no land use, spanning more than 0.5 ha; with trees > 5m & a canopy cover of > 10%, or trees able to reach these thresholds in situ • includes areas under reforestation; temporarily unstocked areas that are able to regenerate • includes firebreaks, windbreaks, tree corridors with area > 0.5ha & width > 20m • excludes tree stands used in agricultural production systems (e.g. fruit plantations, agroforestry systems,..) canopy cover: % of ground area that is directly covered by tree crowns