Download
1 / 17
180 likes | 544 Views
The Weather is Changing. Presented By: Carolyn Sior, New Jersey Becky Wivagg, Texas Marsha Willis, Texas. Abstract.

E N D
The Weather is Changing Presented By: Carolyn Sior, New Jersey Becky Wivagg, Texas Marsha Willis, Texas
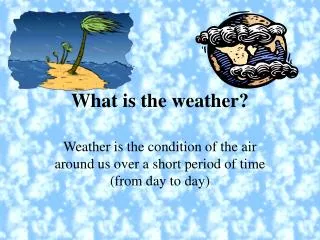
Abstract Scientists observe and investigate the weather systems due to seasonal changes in order to understand and predict atmospheric conditions. Keeping accurate records of air temperature, precipitation, relative humidity, cloud conditions, wind direction, and the systems speed can enable the researchers to make more accurate predictions. Each of these characteristics of the atmosphere affects us and our environment. Engaging students’ natural curiosity about their own world will lead to discoveries and new questions and a better understanding of our earth and how it behaves.
Questions What evidence illustrates the movement of different weather systems in the fall, winter and spring? Are there certain weather systems such as: cold fronts, thunderstorms, “noreasters”, tornadoes and hurricanes that occur more often during certain seasons? How are these systems influenced by the mountains, ocean, or gulf coast?
Hypothesis Collected student data and analysis will identify various weather systems that are predominant in three different seasons. Included in these findings will be the effect of landforms and bodies of water on weather systems through a diversification of data collecting locations.
Introduction Students will participate in a two week atmospheric investigation tracking weather systems in three different seasons, by collecting and sharing data with students from other participating schools. Data will be provided to GLOBE and to a local GLOBE coordinator who will oversee the project. This project will help illustrate the movement of systems and the type of systems that move across the region during the various seasons. Additionally, students will take photos of clouds of the various weather events and share them on the internet.
Background Fronts are the boundaries between air masses of different temperature. If warm air is moving toward cold air, it is a “warm front”. This frontal "system" can be thought of as separating a cold air mass from a warm air mass, and the two different types of fronts simply indicate which direction those portions of the different air masses are moving.
Background Tornados are caused due to the winds from the Gulf of Mexico moving northward in spring and summer, meeting colder, dry Canadian winds moving southward. The place where these two winds meet is called a dry line. High, dry air coming from the north piles on top of low-moving, moist Gulf air at a height of over 10,000 feet. The warm southern winds try to rise, but the cold northern air blocks them. This clash causes the warm, trapped air to rotate horizontally between the two air masses. At the same time, the sun heats the earth below, warming more air that continues to rise. Finally, the rising warm wind becomes strong enough to force itself up through the colder air layer.
Background Hurricanes can develop when the sun’s rays heat tropical waters to at least 82 degrees Fahrenheit. This causes the air to grow warmer and rise. Water rises with it as vapor, and the heat causes the air to rise faster and faster. In about 12 hours, the heated air will begin to circle counterclockwise, forming stronger and stronger winds that whirl with increasing speed.
Standards/Objectives The student will be able to: observe, measure, and record changes in weather, the night sky and seasons. The student will be able to identify the role of atmospheric movement in weather change.
Major Materials for Protocols GLOBE Instrument Shelter Digital Min/Max Thermometer Calibrating Thermometer Barometer Rain Gauge Anemometer Wind sock Compass Cloud Charts Computer with Internet Satellite Imagery Digital Camera GPS Unit
GLOBE Protocols Clouds Water vapor Barometric pressure Relative humidity Max/Min current air temperature Wind direction and speed (aerosols optional)
Other data to be collected: Duration of weather event Possible ocean currents where applicable
GLOBE Activities Observing, Describing, and Identifying Clouds Estimating cloud cover Cloud watch Calculating relative air mass
Data Transformation Local weather data will be collected from an instrument shelter three times a day during a two week period (2 weeks in fall, winter, and spring). Data will be submitted to GLOBE for entry in the database. Additionally, data will be chronicled on an Excel Spreadsheet from which comparison graphs will be constructed.
Data Transformation Local weather radar data, Cloudsat data, and Google Earth Images will be investigated for weather events. Findings will be time/dated, printed, and displayed on a Weather Event Board in the school. Participating schools will be invited to contribute to the collection of data in order to observe weather events as they pass through the region.
Camera Usage Camera Usage A digital portfolio of weather events will be created to visually enhance data findings and weather event board. Images will be displayed in school, e-mailed to fellow participants, and used to springboard interdisciplinary activities (ie: picture prompts, location, artistic interpretations/reproductions, etc.). Development of journal activities to verbally describe observations photographed will be included in the digital portfolio. Students will be encouraged to use weather event visual images whenever possible. A digital portfolio of weather events will be created to visually enhance data findings and weather event board. Images will be displayed in school, e-mailed to fellow participants, and used to springboard interdisciplinary activities (ie: picture prompts, location, artistic interpretations/reproductions, etc.). Development of journal activities to verbally describe observations photographed will be included in the digital portfolio. Students will be encouraged to use weather event visual images whenever possible.
Resources: www.globe.gov http://aim.hamptonu.edu http://spaceplace.nasa.gov/en/kids/cloudsat_puz2.shtml http://www.wildwildweather.com/clouds.htm http://xplanet.sourceforge.net/clouds.php http://www.nws.noaa.gov/ http://www.noaa.gov/ http://www.nhc.noaa.gov/