Download
1 / 18
180 likes | 187 Views
Want to get the difference between Power BI vs Tableau. In this presentation we have given the overview on the difference between Power BI vs Tableau.

E N D
Stat Analytica Power BI vs Tableau: Which is Better Business Tool EVERYTHING YOU NEED TO KNOW
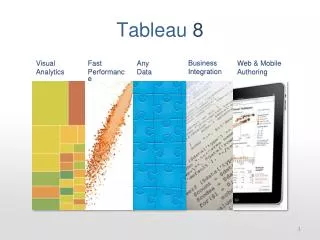
KEY PRESENTATION POINTS Basic Comparison of Power BI vs Tableau Power BI Features Of Power BI Tableau Features Of Tableau Power BI vs Tableau 1. Data Access 2. Visualizations 3. Customer Support 4. Deployment 5. PricingConclusion Presentation Overview
Overview MICROSOFT POWER BI VS TABLEAU IS ALWAYS A CRUCIAL BATTLE FOR DATA ANALYST. POWER BI PROVIDES PLENTY OF FEATURES, LIKEWISE MAPS, SUPPORT, CODING LANGUAGE, ETC. ON THE OTHER HAND, TABLEAU IS WELL FOCUSED ON TO OFFER EXCELLENT DATA VISUALIZATIONS. IN PAST YEARS BOTH THE POWER BI AND TABLEAU ARE BECOMING THE KEY PERFORMERS IN THE BUSINESS INTELLIGENCE TOOLS. IN THE OLD ERA, TABLEAU WAS THE ONLY MOST RELIABLE BUSINESS INTELLIGENCE TOOL. BUT LATER ON, THE POWER BI COME INTO EXISTENCE.
POWER BI TABLEAU Basic Comparison of Power BI vs Tableau Power, BI is not as powerful as Tableau. But it is the best fit for small business. Any small business can afford it, and it offers enough functionality for its operations. Tableau is the best data visualization tool. It provides a variety of visualization tools to make data more approachable for the users.
Power BI Power BI is a part of the Microsoft Corporation. It is one of the best cloud-based business analytics and business intelligence platform. It provides you the full overview of most crucial data for the business.Power Bi primary focus is to provide the best business intelligence and interactive visualizations. As I mentioned above, it is a cloud-based service and also offers the desktop-based interface.It is a complete business intelligence tool because it is offering Various warehouse capabilities like data discovery, data preparation, and interactive dashboards.
CONTENT PACKS PRINT DASHBOARD Features Of Power BI GET DATA SOURCE CUSTOM VISUALIZATION NATURAL LANGUAGE Q&A
Features Of Power BI PRINT DASHBOARD GET DATA SOURCE CONTENT PACKS CUSTOM VISUALIZATION NATURAL LANGUAGE Q&A
Tableau Tableau is the leading visualization tool in the world. It is widely used in the business intelligence industry. The best part of Tableau is, it has the capability to convert the raw data into an understandable format without any coding and technical skills.You can also do data analyzation at a rapid pace in Tableau. You can search for data visualization in both worksheets and dashboards. Tableau also offers you to get actionable insights and create awesome dashboards. It is one of the best business intelligence tools.
Features Of Tableau NO NEED OF TECHNICAL KNOWLEDGE REAL-TIME ANALYSIS DATA BLENDING DATA COLLABORATION DAX ANALYSIS FUNCTION
Power BI vs Tableau LET’S TALK ABOUT THE SIGNIFICANT DIFFERENCE BETWEEN POWERBI VS TABLEAU
Data Access POWER BI TABLEAU Power BI is not the most influential business intelligence tool. Thus it does not allow you to connect your application with the Hadoop database. But you can connect it with some of the less powerful and small in size database like Salesforce and google analytics. Tableau is the most influential business intelligence tool. You can connect it with the Hadoop database. It also can identify the resource automatically. You can connect it with an enormous database. It cab work with any database software.
Visualizations POWER BI TABLEAU Tableau is known for its data visualization functionality. The users can 24 different types of baseline visualizations in Tableau. These visualization includes heat maps, line charts, and scatter plots. You can use it without having the coding knowledge to develop sophisticated and complex visualizations. PowerBI offers numerous data points to provide data visualization.It is offering more than 3500 data points for drilling down the dataset. There is no need to have any coding knowledge to work with the Power BI. It also helps you to create visualization by asking queries with natural language.
Customer Support POWER BI TABLEAU Tableau has excellent customer support. It has a large community forum for discussions. It has also categorized online support into an online desktop and server. Tableau also has over 150,000 active users participating in over 500 global user groups in their community. You can get the direct support on the phone. Power BI provides limited customer support to its users with a free Power BI account. All you can have the support in Power BI but the paid users will get faster support as compared with the free one. It also offers best support, resources, and documentation. It includes guided learning of a user community forum.
Deployment POWER BI TABLEAU Power BI is based on Saas model, ie. Software as a Service. On the other hand, Tableau is available in both the options i.e., the cloud-based and on-premises installation. It works best when there is a vast data in the cloud. On the other hand, Power, BI doesn’t work better with a massive amount of data.
Pricing POWER BI TABLEAU Tableau also offers the three kinds of subscription offering to tailor the user needs. The subscription is as follows Creator, Explorer, and Viewer. The creator plan costs you $70 per user per month. You need to pay the same amount for the on-premise or cloud platform. The Explore plan costs you $35 for on-premises and $42 for the cloud deployment. Power BI offers three subscriptions to its users. It is divided into Desktop, Pro, and Premium. The desktop is free for a single user. Pro subscription starts at $9.99 per user per month. Pro subscription offers additional features like data governance and content packaging and distribution.
If you’re having a small business, then Power BI is the best option for you. It offers necessary features to fulfill the small and medium business needs. On the other hand, if your business is large enough then you should about for Tableau. Because it is most powerful business intelligence tool that can work at any scale of business. Conclusion
FACEBOOK INSTAGRAM TWITTER @statanalytica @statanalytica @StatAnalytica Follow Us on Social Media
WEBSITE https://statanalytica.com EMAIL ADDRESS Info@statanalytica.com Contact Information