Download
1 / 6
60 likes | 76 Views
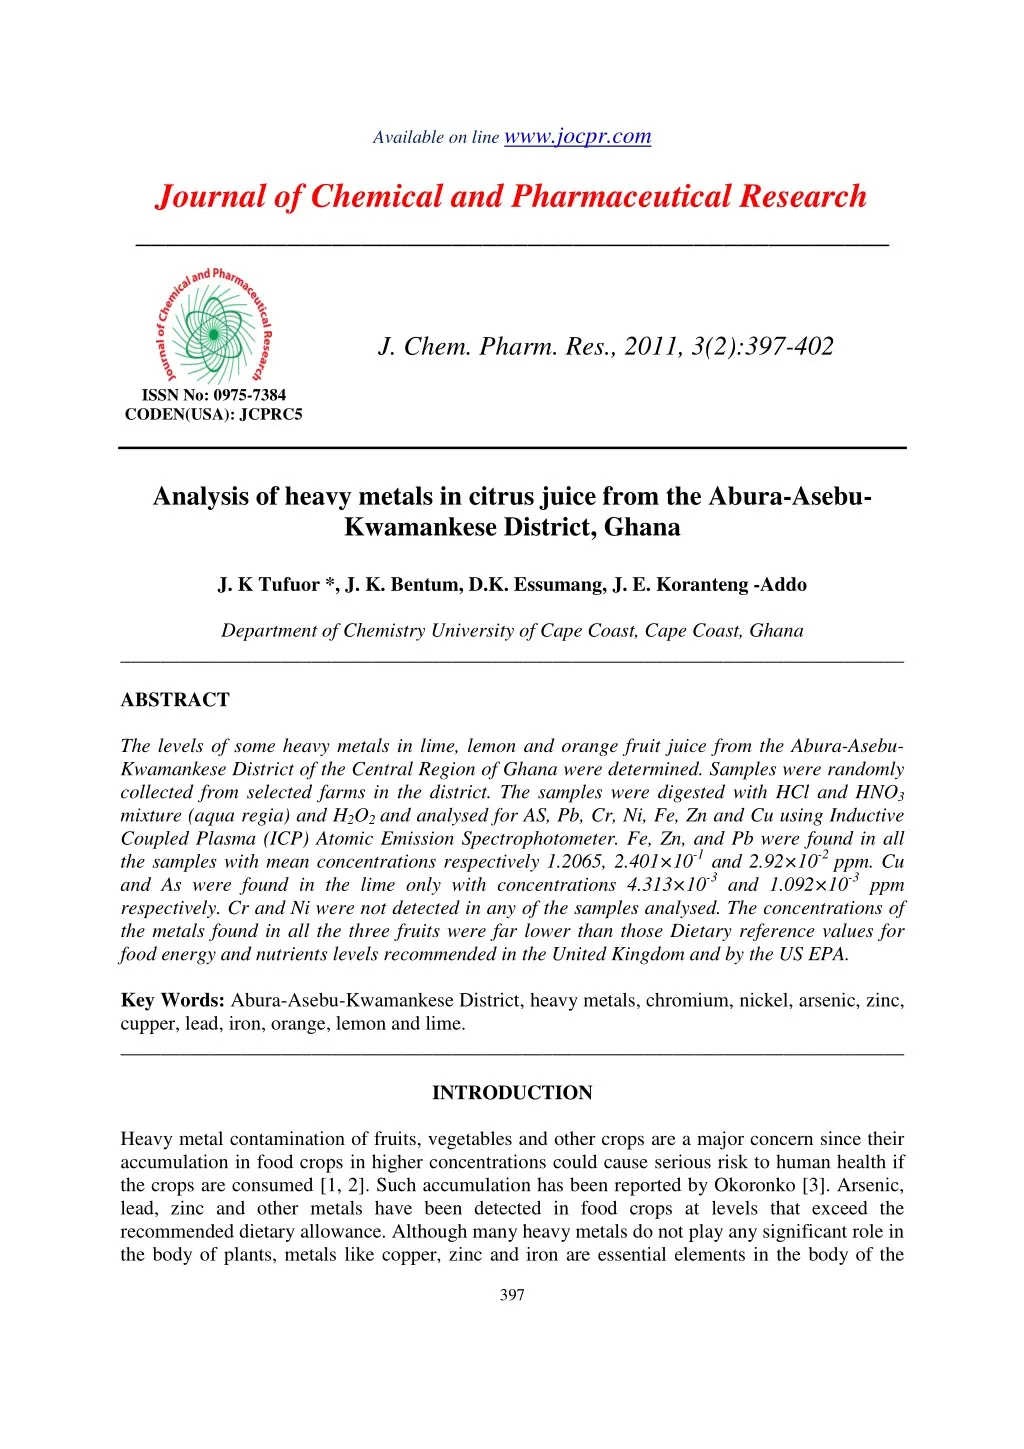
The levels of some heavy metals in lime, lemon and orange fruit juice from the Abura-AsebuKwamankese<br>District of the Central Region of Ghana were determined. Samples were randomly<br>collected from selected farms in the district. The samples were digested with HCl and HNO3<br>mixture (aqua regia) and H2O2 and analysed for AS, Pb, Cr, Ni, Fe, Zn and Cu using Inductive<br>Coupled Plasma (ICP) Atomic Emission Spectrophotometer. Fe, Zn, and Pb were found in all<br>the samples with mean concentrations respectively 1.2065, 2.401×10⁻¹ and 2.92×10⁻² ppm. Cu<br>and As were found in the lime only with concentrations 4.313×10⁻³ and 1.092×10⁻³<br> ppm<br>respectively. Cr and Ni were not detected in any of the samples analysed. The concentrations of<br>the metals found in all the three fruits were far lower than those Dietary reference values for<br>food energy and nutrients levels recommended in the United Kingdom and by the US EPA.<br>

E N D
Available on line www.jocpr.com Journal of Chemical and Pharmaceutical Research __________________________________________________ J. Chem. Pharm. Res., 2011, 3(2):397-402 ISSN No: 0975-7384 CODEN(USA): JCPRC5 Analysis of heavy metals in citrus juice from the Abura-Asebu- Kwamankese District, Ghana J. K Tufuor *, J. K. Bentum, D.K. Essumang, J. E. Koranteng -Addo Department of Chemistry University of Cape Coast, Cape Coast, Ghana ______________________________________________________________________________ ABSTRACT The levels of some heavy metals in lime, lemon and orange fruit juice from the Abura-Asebu- Kwamankese District of the Central Region of Ghana were determined. Samples were randomly collected from selected farms in the district. The samples were digested with HCl and HNO3 mixture (aqua regia) and H2O2 and analysed for AS, Pb, Cr, Ni, Fe, Zn and Cu using Inductive Coupled Plasma (ICP) Atomic Emission Spectrophotometer. Fe, Zn, and Pb were found in all the samples with mean concentrations respectively 1.2065, 2.401×10⁻¹ and 2.92×10⁻² ppm. Cu and As were found in the lime only with concentrations 4.313×10⁻³ and 1.092×10⁻³ ppm respectively. Cr and Ni were not detected in any of the samples analysed.The concentrations of the metals found in all the three fruits were far lower than those Dietary reference values for food energy and nutrients levels recommended in the United Kingdom and by the US EPA. Key Words: Abura-Asebu-Kwamankese District, heavy metals, chromium, nickel, arsenic, zinc, cupper, lead, iron, orange, lemon and lime. ______________________________________________________________________________ INTRODUCTION Heavy metal contamination of fruits, vegetables and other crops are a major concern since their accumulation in food crops in higher concentrations could cause serious risk to human health if the crops are consumed [1, 2]. Such accumulation has been reported by Okoronko [3]. Arsenic, lead, zinc and other metals have been detected in food crops at levels that exceed the recommended dietary allowance. Although many heavy metals do not play any significant role in the body of plants, metals like copper, zinc and iron are essential elements in the body of the 397
J. K Tufuor et al J. Chem. Pharm. Res., 2011, 3(2):397-402 ______________________________________________________________________________ plant due to their physiological functions. The essential elements are very important because they are involved in many enzymes systems in the human body. However, high concentrations are toxic [4]. The sources of these metals in food crops include discharges onto agricultural lands, wastewater from industries and sewage, application of some pesticides, metal aerosol deposition from the atmosphere due to emissions from vehicles and other sources. These trace metals are also translocated from the soil solution through the roots to other parts of the plant [5-7]. Cultivation of Citrus crops is a major source of income for many farmers in the district. Also the leading exporter of lime juice in Ghana and some citrus processing factories obtain their raw materials from the district. Accumulation of these heavy metals in the crops in higher concentrations could cause serious risk to human health if the crops are consumed and also adversely affect export. The objective of the study therefore was to: •Determine the levels of As, Pb, Cr, Ni, Cu, Zn and Fe in orange, lime and lemon fruits grown in the Abura-Asebu-Kwamankese District in Ghana. •Compare the concentrations of the various metals determined in this study with recommended dietary reference values for food energy and nutrients levels in other countries. EXPERIMENTAL SECTION Sample collection Oranges, limes and lemons samples were collected randomly from different farms, in the Abura- Asebu –kwamankese District of the Central Region of Ghana, and placed into appropriately labelled sacks and conveyed to the laboratory for analysis. For each citrus variety, four samples were obtained for each variety. Sample treatment The fruits were washed with tap water and then with distilled water after which the juice were squeezed into separate beakers. About 200 mL of juice was obtained from each sample. The juice were filtered, mixed well and then stored in a refrigerator prior to analysis. 50 mL of sample was placed into a 250 mL beaker. 50 mL of aqua regia prepared from analytical grade concentrated 36% HCl and concentrated 63% HNO3 was added. The mixture was covered with a watch glass, heated and reflux on a hot plate. Additional 10 mL of the aqua regia was added and the heating continued until the colour was very light yellow. The last step was repeated and the solution evaporated until the volume was about 15-20 mL. The solution was cooled and 10 mL of 30% H2O2 (AR) added and heated without boiling until effervescence was minimal to ensure complete digestion. The heating was continued and the volume reduced to about 10 mL. The beaker was removed from the hot plate cooled and the walls washed down with double distilled. The digest was filtered using Whatman No. 4 filter paper into a 50 mL volumetric flask and then diluted with double distilled water to the 50 mL mark. Four samples each of the juice from orange, lemon and lime, and also the spiked samples and blank were digested using this method. All the digested samples were analysed for As, Pb, Cr, Ni, Fe, Cu and Zn using Inductive Coupled Plasma Atomic Emission Spectrometer (ICP). 398
J. K Tufuor et al J. Chem. Pharm. Res., 2011, 3(2):397-402 ______________________________________________________________________________ Recovery and Reproducibility Studies To validate the method of analysis, the precision of the instrument used and the efficiency of the method used in the chemical analysis were determined. The recovery and reproducibility studies were conducted using standards of known concentrations. In the reproducibility studies, known certified concentrations (1.0 ppm) of As, Pb, Cr, Ni, Fe Cu and Zn in double distilled water were analysed separately using Inductive Coupled Plasma Atomic Emission Spectrometer (ICP). The efficiency of the digestion process was determined by analysing the percentage of metal recovered from spiked samples. A blank and standards were use to zero and calibrate the instrument after which the spiked were analysed. Table 1: Reproducibility of recovery of metals from aqueous solution spiked with 1.0 ppm of metal Concentration of metal recovered ( ppm) Arsenic Lead Chromium 1 0.958 0.978 0.987 2 0.967 0.971 0.977 3 0.957 1.013 1.100 4 1.010 1.002 0.978 Mean 0.973 0.991 1.010 SD ± 0.025 ± 0.019 ± 0.059 Table2: Concentration of metal recovered from four samples of lime juice spiked with 2.0 ppm of metal Spiked Lime juice Arsenic Lead Chromium 1 1.957 1.968 1.902 2 1.947 1.978 2.010 3 2.000 1.979 1.984 4 1.958 1.988 1.995 Mean 1.966 1.978 1.973 SD ± 0.023 ± 0.008 ± 0.048 RSD % 1.170 0.404 2.433 Recovery% 98.28 98.91 97.73 Limit of Detection (LOD) = 0.001ppm, Accuracy (as % recovery) at 2.0 ppm The mean percent recovery of spiked elements for all samples range between 96.40% ± 0.048 and -98.91 ± .008 RESULTS AND DISCUSSION The results of the determination of the concentrations of metal in the fruit juice are shown in tables 3-5. The results of the analysis are shown in tables 3-6. Generally the mean concentrations of the metals in all the three samples were as follows: As, 1.092×10⁻³ ; Cu 4.313×10⁻³ :Pb 2.92×10⁻²; Fe 1.2065; and Zn 6.0×10⁻² ppm, Cr and Ni were not detected in any of the samples. The ranges of the metals detected in all the three types of citrus were; As 1.12×10⁻²-1.68×10⁻²; Pb 5.0×10⁻²- .3.486×10-1; Fe 4.27×10⁻¹ – 1.665; Cu 1.0 ×10⁻²- 1.07×10⁻² and Zn 9.14 ×10⁻²– 4.40×10⁻¹ ppm. Apart from Pb which was found to be highest in the lemon juice, with mean 0.3015 ppm, and Nickel 0.965 0.977 0.968 0.968 0.968 ± 0.059 Iron 1.011 1.020 0.959 0.967 0.897 ±0.000 Copper 0.974 0.968 0.969 1.011 0.981 ± 0.021 Zinc 0.975 1.021 1.010 0.987 0.998 ± 0.021 Concentration of metal recovered ( ppm) Nickel 1.965 1.987 2.002 1.898 1.963 ± 0.046 2.343 98.15 Iron 1.887 1.898 1.969 1.956 1.928 ± 0.041 2.127 96.40 Copper 1.969 1.888 1.968 2.008 1.958 ± 0.041 2.094 97.91 Zinc 1.974 1.891 1.989 1.986 1.960 ± 0.046 2.347 98.00 399
J. K Tufuor et al J. Chem. Pharm. Res., 2011, 3(2):397-402 ______________________________________________________________________________ lowest in the orange, the concentrations of all the other metals As, Fe and Zn and Cu were highest in the lime juice and least in the orange juice. Table 3: Concentration of metal in orange juice Orange Arsenic Lead Chromium G1 Nd nd nd G2 Nd nd nd G3 Nd 0.050 nd G4 Nd nd nd Mean Nd 0.013 nd SD ± 0.021 Table 4: Concentration of metals in lime juice Lime juice Arsenic Lead Chromium L1 0.0131 0.1091 nd L2 0.0112 0.0328 nd L3 0.0168 nd nd L4 0.0113 0.0297 nd Mean 0.0131 0.0429 nd SD ± 0.003 ± 0.038 Table 5: Concentration of metal in lemon juice Lemon juice Arsenic Lead Chromium M1 Nd 0 00 0.3029 nd M2 Nd 0.3486 nd M3 Nd 0.2530 nd M4 Nd 0.3001 nd Mean Nd 0.3015 nd SD ± 0.039 Generally the metals detected were found to be highest generally in the lime juice (fig.1) probably due to its high acidity and sequenstration ability. These fruits contain fruit acids such as Citric, tartaric, and malic acids that have the power of chelating heavy metals. The chelating power partly depends on the acidity of the fruit, and since the acidity of the three citrus fruits has been found to be in the order lime> lemon > orange [8-9], it is therefore not surprising that the lime had the highest concentration of trace metals. The mean concentrations of the trace metals were found to be in the order; As< Cu< Pb <Zn < Fe. The order of the non essential elements was (< 0.001ppm) <As < Pb while that of the essential elements was Cu< Fe< Zn, (fig.1). Cr and Ni were not detected in any of the samples analyzed probably because their concentrations were below the detection limit {LOD=0.001 ppm). Concentration of metal orange juice ( ppm) Nickel Iron 0.6171 0.4275 0.4841 0.8171 0.5865 ± 0.173 Copper nd nd nd nd nd Zinc 0.1354 0.1128 0.0914 0.1184 0.1145 ± 0.018 nd nd nd nd nd Concentration of metal in lime juice ( ppm) Nickel nd nd nd nd nd Iron 1.5970 1.6650 1.5360 1.4810 1.5700 ± 0.073 Copper nd 0.100 0.107 nd 0.0518 ±0.0598 Zinc 0.4400 0.2531 0.2989 0.3196 0.3279 ± 0.0797 Concentration of metal in lemon juice ( ppm) Nickel Iron Copper nd nd nd nd nd Zinc 0.3176 0.2981 0.2961 0.1999 0.2779 ± 0.059 nd nd nd nd nd 1.5069 1.5504 1.4707 1.4630 ± 0.0982 400
J. K Tufuor et al J. Chem. Pharm. Res., 2011, 3(2):397-402 ______________________________________________________________________________ Figure 1: Concentration of some heavy metals in orange, lemon and lime fruits from Abura- Asebu- Kwamankese District of Ghana The concentrations of the metals found in all the three fruit were far lower than those Dietary reference values for food energy and nutrients levels recommended in the United Kingdom by the Department of Health committee on medical aspect of food policy and the US EPA [10-17] Though there were correlations among the metals in all the fruits, most of these were not significant at the 0.05 level. The significant correlations observed were very high, and these were between Cu and each of the metals Fe, As and Zn in the lime juice. In each case the value of r was 1.0 at the 0.01 confidence level. CONCLUSION The results obtained indicate that traces elements, both essential and non essential heavy metals were present in citrus fruits from the Abura- Asebu- Kwamankese District of Ghana. Fe, Zn, Pb, Cu and As were detected in the citrus fruits analysed, with mean concentrations 1.2065, 2.401×10⁻¹, 2.92×10⁻² ppm, 4.313×10⁻³ and 1.090×10⁻³ ppm respectively. Cr and Ni were not detected in any of the samples. The levels of the essential metals Cu, Zn and Fe were far below the recommended daily intake. It is therefore safe to consume oranges, lemons or limes from the Abura- Asebu- Kwamankese District of Ghana since the levels of all the metals found in them were far lower than dietary reference values recommended by the United Kingdom Department of Health and the US EPA. Acknowledgements We wish to thank the Fruits and Flavour Industry and all the farmers for their support during the collection of samples. We are also grateful to the Tema Oil Refinery (TOR) for their technical support. 401
J. K Tufuor et al J. Chem. Pharm. Res., 2011, 3(2):397-402 ______________________________________________________________________________ REFERENCES [1]D Vousta.; A. Grimarins; C. Sammara,. Environ. Pollut. 1996; 94(3),325-335 [2]D.J.Ashworth,; B J Alloway. Environmental Pollut.,2004, 127, 137-144. [3]N E Okoronkow , J C Igwe and E C Nwuchekwa . African J. of Biotechnology Vol. 4 (13) (Dec. 2005; .1521-1524, [4]D M Miller and W P Miller. Land application of waste. Summer M.E(ed) Handbook of soil science CRC Books New York; 2000. [5]A Shenkin . Micronutrients in clinical nutrition. Enteral and Tube feeding 3rd Ed. Ed J L, Rombeau, R H Rolandelli and W B Saunders1997, 96 [6]S S Dara . A Text book of Environmental chemistry and Pollution Control. Rjendra, Rarindra printers (PVT) Ltd. Ram Niger, New Delhi 1993; 10055, 167-206 [7] Ademoonti CMA. Bioaccumulation of Heavy Metals in some Mangroves fauna and flora in Environmental Chemistry and Toxicology March printers & Consultancy Benin. 1995; . 180-182. [8]J B S Braverman, Citrus Product. International publishers Inc., NY, 1949; 105-106, 133-135, 333-334 [9]A Chulme., The biochemistry of fruits and products. Arc food research inc Norwich, England; 1981; 91-97 [10]Department of Health, Committee on Medical Aspect of Food Policy. Dietary value for food energy and nutrients in the United Kingdom. Report on Health and Social subjects, No 41(London, The Stationery Office) [11]G Ysart,. et al, Food Additives and Contaminants1999; 16(9) 391-403. [12]G Ysart,. et al, Food Additives and Contaminants2000;17(9) 775-786. [13]Population reference intakes, Commission of the European Community. Reports of the Scientific Committee for Food. (31st Series) 1992; Chapter 37 [14]D G Barceloux, Zinc, Journal of Toxicology: Clinical Toxicology, 1999; 32,279-292 [15]D G Barceloux,, Copper, Journal of Toxicology: Clinical Toxicology, 1999; 37,217-230 [16]D G Barceloux, Nickel, Journal of Toxicology: Clinical Toxicology, 1999; 37,239-258 [17]U S EPA. 2001. U S EPA Integrated Risk Information System (IRIS) reference 402