Download
1 / 7
70 likes | 80 Views
A systematic study has been carried out to explore the physicochemical characteristics of drinking water sources of<br>Kandukur revenue sub-division, Prakasam (District) in Andhra Pradesh, India. Totally 48 water samples were<br>collected from the different locations (24 villages) of the study area including bore well and hand pump water and<br>analyzed for pH, EC, TDS, turbidity, total hardness, fluoride, chloride, nitrate, nitrite, sulphate, phosphates,<br>calcium, magnesium, sodium, potassium, Iron and dissolved oxygen. The concentrations of investigated parameters<br>in the drinking water samples from Kandukur mandal were within the permissible limits of the World Health<br>Organization drinking water quality guidelines and the ISI guidelines. On an average, in almost all the samples, one<br>or the other chemical constituent was beyond the permissible limits it was also concluded that water sources in the<br>study area not fit for potability. Sodium absorption ratio (SAR) and water quality index (WQI) studies indicate<br>ground water available from all sources not fit for drinking and irrigation also. The study indicates the need for<br>periodic monitoring of ground water in the study area. <br>

E N D
Available online www.jocpr.com Journal of Chemical and Pharmaceutical Research, 2012, 4(1):601-607 ISSN : 0975-7384 CODEN(USA) : JCPRC5 Research Article Physico-chemical analysis of drinking water resources of Kandukur revenue sub-division, Prakasam District in A.P., India Y.Hanumantharao1, Medikondu Kishore2*, K.Ravindhranath3 1Andhra Loyola College (Autonomous), Vijayawada, Krishna Dist., Andhra Pradesh, India 2Department of Chemistry (S&H), PSCMR College of Engineering and Technology, Vijayawada, Krishna Dist., Andhra Pradesh, India 3Department of Chemistry, Bapatla Engineering College, Bapatla, Guntur Dist., Andhra Pradesh, India _____________________________________________________________________________________________ ABSTRACT A systematic study has been carried out to explore the physicochemical characteristics of drinking water sources of Kandukur revenue sub-division, Prakasam (District) in Andhra Pradesh, India. Totally 48 water samples were collected from the different locations (24 villages) of the study area including bore well and hand pump water and analyzed for pH, EC, TDS, turbidity, total hardness, fluoride, chloride, nitrate, nitrite, sulphate, phosphates, calcium, magnesium, sodium, potassium, Iron and dissolved oxygen. The concentrations of investigated parameters in the drinking water samples from Kandukur mandal were within the permissible limits of the World Health Organization drinking water quality guidelines and the ISI guidelines. On an average, in almost all the samples, one or the other chemical constituent was beyond the permissible limits it was also concluded that water sources in the study area not fit for potability. Sodium absorption ratio (SAR) and water quality index (WQI) studies indicate ground water available from all sources not fit for drinking and irrigation also. The study indicates the need for periodic monitoring of ground water in the study area. Key words: Kandukur revenue sub division; Water quality; Physico-chemical analysis; Water quality index; SAR. _____________________________________________________________________________________________ INTRODUCTION Ground water is one of the essential components for the sustenance of life on earth. Among the various sources of water, ground water is said to be the safest water for drinking and domestic purposes. The quality of ground water is influenced by the nature of the sub surfaces as well as the environment where recharge takes place. Water used for industries, agricultural and human needs adds continuously contaminants to the ground water. It is reported that two third of all illness in India are related to water born diseases [12]. Geography of the investigated site Kandukur revenue subdivision comprises of Kandukur town (a municipality) and mandal (Fig.2) having more than 24 villages in the Prakasam in the Indian state of Andhra Pradesh. Kandukur town is located 52.5 km distance from its District Main City Ongole. It is located 281 km distance from its State Main City Hyderabad. Kandukur (Earlier known as Skandapuri) is located at 17°04′N 78°29′E/17.07°N 78.49°E[4] (Fig. 1). It has an average elevation of 632 meters (2,073 ft), Latitude 17.0664, Longitude 78.4892, Altitude (feet) 2073, Lat (DMS) 17° 3' 59N,Long (DMS) 78° 29' 21E, Altitude (meters) 631. Telugu, the regional language of the state of Andhra Pradesh is spoken in Kandukur. As of 2001 India census [2], Kandukur town had a population of 1,50,084. Males constitute 51% of the population and females 49%. Kandukur has an average literacy rate of 63%, higher than the national average of 59.5%: male literacy is 72%, and female literacy is 55%. In Kandukur, 11% of the population is under 6 years of 601
Medikondu Kishoreet al ______________________________________________________________________________ J. Chem. Pharm. Res., 2012, 4(1):601-607 age. Kandukur has a historic background. Skandapuri which was an area ruled during Srikrishna Devaraya period was renamed as Kandukur. It is now one of the fastest developing towns in the state. A water quality index (WQI) [10] is common with many other indices system transforms a group of water quality parameters to a common scale and combines them to form single number in accordance with a chosen method or model computation. The main objective of the WQI system is to use it as a preliminary means of assessing a water body for compliance with the standards adopted for designated classes of beneficial uses. A WQI is defined as the composite influence of different water quality parameters in the quantity of water [9]. Fig. 1: Location of Kandukur mandal in Andhra Pradesh Fig.2:Area of Kandukur mandal 602
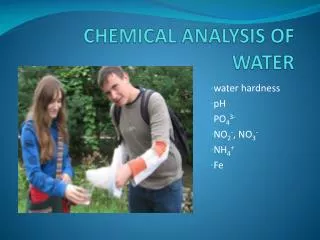
Medikondu Kishoreet al ______________________________________________________________________________ J. Chem. Pharm. Res., 2012, 4(1):601-607 EXPERIMENTAL SECTION Water sample Collection Water samples have been collected manually from all existing sources of drinking water in the study and for the present investigation separate sets of samples were collected for chemical analysis from the source. The bottles for sample collection have been thoroughly cleaned by rinsing with 8M HNO3, followed by repeated washing with double distilled water and they are further rinsed with sample water before collection. Physico chemical analysis was done by standard procedure [1].The results were compared with WHO[14], USEPA[13] standards. Mathematical modeling [3] Mathematical modeling offers more attractive studies, though it deviates much from real situations. The statistical parameters correlation studies, mean, minimum (min), maximum (max) were computed by using the experimental data. Water Quality Index WQI has been derived using the following formula: ??? ? Where Qi is the quality rating/sub index The ground water quality rating was calculated by applying the formula: ?? ??? ? ?? ?? ? ??? 100 Where Mi is the estimated value of the ith parameter in the laboratory, Li is the ideal value of the ith parameter and Si is the standard values of the ith parameter. Wi is the unit weight, which was calculated by the following formula: ?? ?? Where K (constant of proportionality) = (? S n is the standard values for different water quality parameters. Sodium absorption ratio (SAR) studies [9] SAR and %Na were calculated from following method listed in Richard, (Richards LA, et al 1954) as follows: ?? ?? ?? ?? ? ??? ? ??? ?. ? ??? ??? ??? ??? ? !"???? ?#?? % 2 '???? ??( %?? ? ')Ca 2 ? ??#??? ???? ???(? 100 RESULTS AND DISCUSSION The findings of present investigation are summarized in Tables 1a&b to 2a&b were also made with WHO and USEPA drinking water standards. In the following text two types of waters are discussed in the order of BW and HP respectively. 1.The pH values vary from 7.65 to 9.17and from 7.3 to 8.4 in the study area respectively. The higher electrical conductivity(above 2000 µs)values in samples,2, 4, 5, 7,8 & 13 of bore wells water and in samples 6, 7, 12, 19 of hand pump-water clearly indicate that water is unfit for human consumption. 2.Total dissolved solids (TDS) values have varied from 405.11 to 4074mg/L and from 134.5 mg/L to 3993.2 mg/L in all two existing sources of drinking water. The results of total dissolved solids indicate that many samples of water from bore wells and hand pumps contain high dissolved solids. 3.Turbidity gives the water a cloudy appearance or shows up as dirty sediment. It was clearly indicates all the samples collected from study area were with in the permissible limit [14]. 603
Medikondu Kishoreet al ______________________________________________________________________________ J. Chem. Pharm. Res., 2012, 4(1):601-607 4.Total Hardness (TH) is the aesthetic objective is set at a maximum of 800mg/L [14]. Hardness is not deleterious to health although it has been suspected to be playing some role in heart disease [6]. In the study area, the total hardness in water from all the groundwater resources range between 118.8 to 2291.3 and 258.9 to 2235.2 as CaCO3 of samples respectively. The main source of fluoride and their concentrations in water is geological sources [14] [5]. 5.A colorless and odorless natural pollutant fluoride (F-) comes in to contact with ground water from its source of origin, the rock minerals. The maximum permissible limit in drinking water is 1.5 mg/L [14]. The concentration of fluoride ion in water samples has been analyzed by SPADNS technique[1]. The concentration of fluoride in all samples of study area has varied from 1.22 to 3.09 mg/L, and 1.4 to 4.6 mg/L respectively. From chemical analysis the study area was broadly classified into four categories depending upon the concentration of fluoride ion. 4 of BW and 12 of HP water samples are within the range of 1.50 to 2.00 mg/L, 05 water samples from bore well, 13 from hand pump water was fallen within the range of 2.01 to above mg/L concentration of fluoride ion, but only 7 from bore well and from hand pump water samples having less than 1.5 mg/L concentration. 6.The USEPA drinking water regulations recommended a maximum concentration of 250 mg/L for chloride (Cl-) ions. High chloride contents are observed in samples 2,7,10, 13, 14, 18, 19, 22 and 23 of bore wells water and in samples 3,4,10,11,12,14,17,18 and 21 of hand pumps water. The higher concentration is usually indicative of polluted nature of water. 7.The USEPA maximum contamination limit for nitrate is 10 mg/L and for nitrite is 1mg/L. Concentration of nitrate above 4 mg/L can cause Methamaglobinemia (blue – baby disease) in children [8][15]. The concentrations of nitrate in all the samples in the study area are ranges from 0.43 to 4.30 mg/L and 0.4 to 4.30 mg/L in all sources respectively. The results indicate that the nitrate concentration is within the permissible limit in most of the samples. The concentrations of nitrite (NO2 0.1 to 1.8 mg/L. 8.The Sulphate (SO4 different type’s water samples respectively. The results also indicate that the values of Sulphate in all the samples are within the permissible limit (250mg/L). Phosphate (PO4 9.The concentration of calcium (Ca2+) has varied from 12.51 to 335.52 mg/L, and 22.3 to 332.4mg/L. Higher value of calcium may be due to the presence of rock soil in the study area. The concentration of magnesium (Mg2+) is higher in samples 2, 7, 10, 11-15, 22-24 of bore wells, in samples hand pump water 3, 7, 12 - 13, 15, 16, 19, 20, 22 - 24. This higher value of magnesium may be from leaching of rocks. The concentration of sodium (Na+) ranges from 93.0 to 280.0 mg/L in bore wells, 38 to 286.0 mg/L in hand pumps and water respectively in the study area. The concentration of potassium (K+) ranges from 0 to 20.0 mg/L in bore wells, from 0.00 to 32.00 mg/L in hand pumps respectively in the study area. Its concentration however is usually quite lower than that of sodium, calcium and magnesium. 10.Dissolved oxygen (DO) ranged from 2.20 to 9.20 mg/L, 1.2 to 9.3 mg/L in two deferent types of samples. 11.The sodium absorption ratio was calculated in given water samples, which provide a useful index of the sodium hazard present in soil and crops irrigated with such. A high sodium absorption ratio (2 to10) indicates little danger for sodium; medium hazard are between 7 and 18; high hazard between 11 and 26 and very high hazard above that. Lower the ionic strength of the solution, the greater sodium hazard for a given SAR (The value of SAR in the ground water samples of the study area ranges from 24.22, 23.83 for HP and BW. It was clearly indicates the ground water of the study area falls under the category of very high hazards. The value of sodium percentage in the ground water sample of the study area ranged from 54.22, 55.63 for two different types of samples. Based on this observations it was not quite safe for irrigation and potability [11]. 12.Prescribed water quality rating (WQI) for drinking purposes is presented in broadly divided into five categories, excellent (0 to 25), good (26 to 50), poor (51 to 75), very poor (76 to 100) and unfit for drinking water (>100). It is observed that the WQI values for hand pump water is 140.2, for bore well water it was 132.8 indicating that Physico chemically water quality rated as unfit for drinking’ purpose [7]. Statistical analysis Positive correlation is obtained between EC and TH (r = 0.99, 0.99, 1.0), Na and Cl- (r =0.72, 0.60, 0.99) in hand pump, bore well samples. This indicates that conductivity depends on the salts of chloride of sodium and potassium. Total hardness showed positive correlations with EC, Cl- (r = 0.93) Mg2+ (r = 0.95) and Na+ (r = 0.64, 0.57, 0.92) in all three types of samples. This indicates that the hardness of water was contributed mainly by the salts of chlorides of Na, Mg and careful examination of results of water from study area reveals that a large number of pairs of parameters have high positive correlations (r > 0.85)(M.Kishore 2011). The significant correlations of EC, TDS with TH, SO4 water quality parameters, EC and TDS are easily determinable. Hence on knowing this value exactly, we can calculate the other parameters, which are in good agreement with experimental data. So, this correlation determination provides quick monitoring of the quality of ground water. -) in all samples of the study area are fall under the range of 0.08 to 3.16 mg/L and 2-) contents in all samples have varied from 2.24 to 83.71 mg/L, 4 to 61.7 mg/L in two 3-) values are within the permissible limit. 2-, Ca2+ and Mg2+ indicate the presence of sulphates of calcium and magnesium. Compared with the other 604
Medikondu Kishoreet al ______________________________________________________________________________ J. Chem. Pharm. Res., 2012, 4(1):601-607 Table 1a: Physico chemical analysis of bore-well water samples Turbidity (NTU) 6.14 0 2.05 2.05 2.05 4.09 2.05 5.12 2.05 3.07 5.12 3.07 6.14 5.12 3.07 2.05 1.02 2.05 3.07 3.42 0 6.14 3.12 1.08 0 6.14 2.91 TH F - Cl- EC(µs) S.No Name of the Village pH TDS (ppm) (as CaCO3) 306.87 787.63 398.93 378.47 122.75 128.89 787.63 358.02 227.08 685.34 1227.48 1577.31 2291.3 869.47 726.26 327.33 398.93 340.63 1261.24 1022 122.75 2291.3 694.82 118.8 118.8 2291.3 745.41 1 2 3 4 5 6 7 8 9 10 11 12 13 14 15 16 17 18 19 20 21 22 23 24 Kammarivari palem Chirrikurapadu Balijapalem Pandalapadu Jillelamudi Vikkiralapeta Palukuru Narisetty varipalem Kondi kandukur Kovuru Mahadevapuram Dubagunta Ananthasagaram Oguru Venkatadripalem Ganigunta Kancharagunta Gallavaripalem Kondamudusu palem Anandapuram Mopadu Paluru M.G.Puram Machavaram Min Max Mean 8.07 7.65 7.93 7.79 8.64 8.4 8.53 8.66 8.79 8.91 9.04 9.17 8.24 8.09 8.52 8.3 8.22 7.67 7.78 7.98 7.65 9.17 8.34 7.88 7.65 9.17 8.32 99.05 2797.43 1059.11 2353.36 3544.36 1293.32 7046.78 2046.4 2268.43 1296.39 1391.55 1388.48 2596.88 1315.84 1033.43 790.32 1257.51 1385.41 702.94 804 99.05 7046.78 1877.21 802 99.05 7046.78 2008.57 2086.3 1598.1 1463.3 740.98 588.62 575.14 1630.8 1290.8 1368.4 2712.3 801.03 405.11 4074.5 1188.6 1307.1 432.48 714.23 1257.2 1340.8 1200 405.11 4074.5 1346.1 988 405.11 4074.5 1369.7 3.05 3.09 3.08 2.92 2.88 2.74 2.14 3.01 1.9 1.61 2.75 2.6 2.37 2.94 2.71 2.41 2.82 2.39 2.7 1.22 1.61 3.09 2.64 1.28 1.22 3.09 2.47 152.22 673.9 152.22 101.48 57.99 72.48 521.88 217.45 245.02 347.92 245.02 171.51 340.67 362.42 202.95 115.97 123.22 558.13 269.73 212 57.99 673.9 259.59 136 57.99 673.9 266.06 Table 1b: Physico chemical analysis of bore-well water samples S.No NO2- NO3- SO42- PO43- 1 0.1 1.04 41.86 0.21 2 2.04 3.13 5.1 0.41 3 0.08 3.28 32.67 0.41 4 0.82 0.8 8.17 0.06 5 1.07 1.45 5.1 0.16 6 0.32 1.51 6.13 0.47 7 0.1 2.26 79.63 0.39 8 0.31 2.47 12.25 0.49 9 2.14 3.89 5.1 0.28 10 1.02 3.28 15.31 0.33 11 0.1 0.43 6.13 0.38 12 0.33 0.43 41.86 0.01 13 0.3 4.3 83.71 0.06 14 0.1 1.45 28.59 0.96 15 1.67 1.51 34.71 0.24 16 0.39 2.47 14.29 0.12 17 0.46 2.47 15.31 0.15 18 3.16 4.3 21.44 0.26 19 0.57 1.51 7.15 0.34 20 0.21 1.11 2.24 0.32 21 0.08 0.43 5.1 0.01 22 3.16 4.3 83.71 0.96 23 0.79 2.21 24.45 0.3 24 1.4 1.53 16.88 0.17 Min 0.08 0.43 2.24 0.01 Max 3.16 4.3 83.71 0.96 Mean 0.9 2.2 24.13 0.32 Ca2+ 61.38 204.59 85.93 53.19 32.73 32.87 147.3 53.19 43.08 57.28 88.12 12.51 335.52 110.47 73.65 32.73 65.47 23.85 66.38 32.55 12.51 335.52 83.17 18.88 12.51 335.52 87.02 Mg2+ 61.38 110.47 73.65 98.2 16.37 90.49 167.75 90.01 98.35 216.86 100.42 125.8 581.02 237.32 216.86 98.2 94.11 125.67 24.81 32.3 16.37 581.02 138.3 198 16.37 581.02 153.58 Na+ 220.51 203.16 212.35 189.89 251.14 214.39 151.09 247.06 251.14 38.79 150.07 238.89 206.22 291.98 187.85 253.18 268.5 239.91 149.05 122 38.79 291.98 208.69 178 38.79 291.98 199.31 K+ 8.17 1.1 6.13 4.08 6.13 5.1 14.29 2.04 5.1 1.02 1.02 1.02 6.13 18.38 6.13 32.67 2.04 5.1 2.04 2 0 32.67 6.66 2.11 0 32.67 7.04 DO 3.57 7.25 2.25 3.98 7.76 9.6 3.16 2.25 6.53 5.92 3.16 6.23 6.23 7.76 7.96 2.25 2.25 2.96 7.76 6 2.25 9.6 5.2 2.23 2.23 9.6 5.24 605
Medikondu Kishoreet al ______________________________________________________________________________ J. Chem. Pharm. Res., 2012, 4(1):601-607 Table 2a: Physico chemical analysis of hand-pump water samples TDS (ppm) Kammarivari palem 7.59 1207.85 699.78 Chirrikurapadu 7.33 1016.66 1481.26 Balijapalem 7.31 866.13 1666.29 Pandalapadu 7.44 967.09 1370.04 Jillelamudi 7.38 1009.58 134.48 Vikkiralapeta 8.07 3026.71 2347.77 Palukuru 8.1 2318.59 1332.63 Narisetty varipalem 7.58 1361.61 317.08 Kondi kandukur 7.72 952.93 534.57 Kovuru 8.41 677.97 374.71 Mahadevapuram 7.7 987.32 562.68 Dubagunta 7.67 6676.56 3933.18 Ananthasagaram 8.09 743.63 1233.54 Oguru 7.58 997.44 1330.61 Venkatadripalem 7.99 1278.66 1258.82 Ganigunta 7.6 942 Kancharagunta 8.28 670.2 Gallavaripalem 7.58 976 Kondamudusu palem 7.55 6600 Anandapuram 7.96 735.1 Mopadu 7.46 986 Paluru 7.86 1264 M.G.Puram 7.26 1003 Machavaram 7.47 1194 Min 7.3 670.2 Max 8.4 6676.6 3933.2 Mean 7.7 1602.5 1234.3 Turbidity (NTU) 3.03 5.06 2.02 4.05 8.09 1.01 6.07 1.01 3.03 0.81 1.01 8.09 1.01 3.03 2.02 3 0.8 1 8 1 3 2 1 3 0.8 8.1 3 TH F - Cl- EC(µs) S.No Name of the village pH (as CaCO3) 333.76 374.22 576.5 586.61 258.92 333.76 668.54 424.79 546.16 1247.06 1236.94 2235.19 475.36 657.41 326.68 540 1233 1223 2210 470 650 323 570 330 258.9 2235.2 743 1 2 3 4 5 6 7 8 9 10 11 12 13 14 15 16 17 18 19 20 21 22 23 24 2.33 3.28 4.55 4.29 3.05 3 3.05 1.44 1.88 2.67 2.11 3.46 3.12 3.66 3.3 1.86 2.64 2.09 3.42 3.08 3.62 3.26 2.18 2.3 1.4 4.6 2.9 114.9 215.43 272.88 287.24 107.71 84.96 188.12 165.16 193.89 404.56 416.7 1019.69 93.35 284.52 63.05 191.7 400 412 1008.2 92.3 281.31 62.34 213 113.6 62.3 1019.7 278.6 528.7 370.6 556.5 3890 1220 1316 1245 1226 692.1 134.5 Table IIb: Physico chemical analysis of hand-pump water samples S.No NO2- NO3- SO42- PO43- 1 0.16 1.74 20.23 0.24 2 1.66 2.03 18.21 0.35 3 1.06 3.21 7.08 0.11 4 0.68 4.26 28.32 0.43 5 0.12 1.15 10.11 0.41 6 0.16 2.04 7.08 0.25 7 0.81 4.26 32.36 0.03 8 0.51 4.07 28.32 0.08 9 1.82 4.26 44.5 0.6 10 0.12 0.42 12.14 0.26 11 0.91 2.04 34.39 0.35 12 0.3 2.04 61.7 0.15 13 0.51 2.24 23.26 0.08 14 1.24 2.04 4.05 0.13 15 1.11 2.45 5.06 0.12 16 1.8 4.21 44 0.598 17 0.12 0.42 12 0.257 18 0.9 2.139111 34 0.346 19 0.3 2.02 61 0.145 20 0.5 2.21 23 0.082 21 1.23 2.02 4 0.125 22 1.1 2.42 5 0.122 23 0.34 1.32 52 0.072 24 0.16 1.72 20 0.242 Min 0.1 0.4 4 0 Max 1.8 4.3 61.7 0.6 Mean 0.7 2.4 24.7 0.2 Ca2+ 68.91 137.83 125.66 166.2 30.44 34.89 54.82 72.97 85.13 32.73 22.59 332.4 72.97 52.62 50.77 84.168 32.36 22.34 328.656 72.144 52.03 50.2 108.216 68.136 22.3 332.4 90 Mg2+ 64.86 12.16 105.4 68.91 81.17 87.3 101.37 97.29 133.77 69.12 97.45 563.46 117.56 63.74 103.18 132.264 68.34 96.35 557.112 116.232 63.02 102.02 120.24 64.128 12.2 563.5 128.6 Na+ 202.28 224.53 200.26 240.71 94.06 218.46 228.58 230.6 214.42 271.06 149.69 147.66 212.39 289.26 233.63 212 268 148 146 210 286 231 160 200 94.1 289.3 209.1 K+ DO 14.16 1.01 4.05 20.23 0 2.02 3.03 6.07 7.08 6.07 8.09 12.14 0 6.07 2.02 7 6 8 12 0 6 2 8 14 0 20.2 6.5 2.4 2.55 4.32 2.43 2.22 2.12 4.2 5.6 6.8 8.2 1.2 2.3 2.77 3.42 3.22 2.33 2.11 4.55 6.7 8.3 2.7 3.8 9.3 2.5 1.2 9.3 4 CONCLUSION The result of this study indicates that the quality of ground water varies from place to place. Higher values of certain parameters at certain bore wells and hand pump water samples are not fit for drinking as such. The water quality index, sodium absorption ratio studies and %Na studies indicates poor quality of water for drinking as well as 606
Medikondu Kishoreet al ______________________________________________________________________________ J. Chem. Pharm. Res., 2012, 4(1):601-607 agricultural purpose. Hence, proper care must be taken to avoid any contamination of ground water and its quality be monitored periodically. REFERENCES [1].American Public Health Association (APHA), Standard methods for the examination of water and wastewater, (18thEdn), Washington DC. 1992. [2].Census of India. Data from the 2001 Census, including cities, villages and towns (Provisional). Census Commission of India2001. [3].JE Freund. Modern elementary statistics (5Th Edn) Eastern economy editions, Prenticehall of India, New Delhi 1981. [4].http://www.fallingrain.com/world/IN/02/Kandukur3.html [5].M Kishore; K.Somasekhara rao; Ind.J.Env.Prot2004:24(12), 908-916 [6].M Kishore; K.Somasekhara rao; Ind.J.Env.Prot2005:25(10), 919-924 [7].M.Kishore; D.Sarada; KS Rao;Chem.Environ.Res.200615 (1&2), 204-211 [8].Medikondu Kishore; Y Hanumantharao; Y. E-J Chem.,2010: 7(S1), S587- S593 [9].A Moharir; Ind. J. Env. Prot.,2002: 22(9), 961-969. [10].CR Ramakrishnaiah; C Sadashivaiah; E-Journal of Chemistry; 20096(2), 523-530 [11].LA Richards; Diagnosis and improvement of saline and alkali soil. U.S. Dept. of Agriculture, Agriculture handbook 1994. [12].MFR Sowers; MK Clark; Am J Epidemiol,1991; 133: 649–60 [13].US Environmental Protection Agency (EPA). EPCRA Section 313. Reporting Guidance for Food Processors. Washington, DC: EPA Office of Pollution Prevention and Toxics (1998a). [14].World health organization; Guide lines for drinking water quality (2ndEdn) Health criteria and other supporting information. 1996 Vol.2.Geneva, 231-237. [15].N G Telkapalliwar and B B. Shende; J. Chem. Pharm. Res.,2011, 3(1):176-179 607