Download
1 / 7
70 likes | 80 Views
There are many methods proposed to predict transmembrane protein topology. However, these methods have some<br>shortcomings to correctly predict the boundary of the transmembrane region. In this paper, a new transmembrance<br>prediction based on data fusion technology is proposed. The results of different prediction methods, described as<br>different interval number, can be combined with induced ordered weighted averaging operator to determine the<br>appropriate fuzzy interval. The appropriate fuzzy interval can be determined. The transmembrane regions can be<br>predicted by choosing the threshold. The effectiveness of the transmembrane prediction is verified by experiments.

E N D
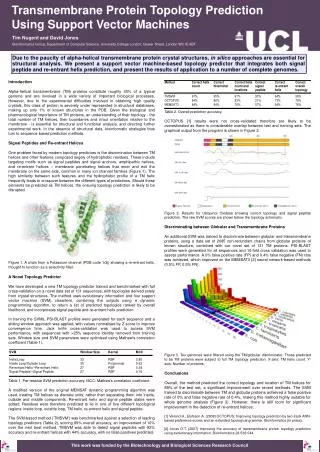
Available online www.jocpr.com Journal of Chemical and Pharmaceutical Research, 2013, 5(9):465-471 ISSN : 0975-7384 CODEN(USA) : JCPRC5 Research Article Research on prediction of transmembrane protein topology based on fuzzy theory Xian Wen Luo1 Zuo Ying Liu2 1Information Management Department Southwest University Chongqing, China 2Department of Basic Sciences, Southwest University Chongqing, China _____________________________________________________________________________________________ ABSTRACT There are many methods proposed to predict transmembrane protein topology. However, these methods have some shortcomings to correctly predict the boundary of the transmembrane region. In this paper, a new transmembrance prediction based on data fusion technology is proposed. The results of different prediction methods, described as different interval number, can be combined with induced ordered weighted averaging operator to determine the appropriate fuzzy interval. The appropriate fuzzy interval can be determined. The transmembrane regions can be predicted by choosing the threshold. The effectiveness of the transmembrane prediction is verified by experiments. Key words: Transmembrane protein topology prediction; Fuzzy set theory; IOWA operator; Information fusion _____________________________________________________________________________________________ INTRODUCTION Transmembrane protein is a particular and important class in proteins, the particularity is that it spans the phospholipid bilayer of cell membrane. Transmembrane protein is important because it gives the membrane a variety of functions. Some transmembrane proteins can be used as "carrier" to transport material in or out of cells, some transmembrane proteins are specific receptors for hormones or other chemicals, and some transmembrane proteins determine the identification function of cells. Because of this, the research on the entire membrane protein topology is very meaningful. However, so far only a small part of the transmembrane protein structure is known. Although the multi-dimensional nuclear magnetic resonance (NMR), X-ray crystallography, electron diffraction of two-dimensional and three-dimensional image reconstruction technology, provide an effective test method for the determination of protein structure, these methods are time consuming and require quantity and purity of the sample so their applications subject to considerable restrictions. Therefore, the study on simple prediction method of protein structure is very urgent, and it is an important research field in bioinformatics. So far, there are two known structures of transmembrane protein: the helix bundle formed by helices and the barrel structure folded by barrel. This paper focuses on the prediction methods of topology structure of helical transmembrane protein. The helical membrane protein has two significant features, and the currently existing prediction methods are directly or indirectly developed on the basis of these two features. The two notable features are as follows: [1] The transmembrane region has a strong hydrophobic. [2] "Positive-inside rules", that is, Lys and Arg --- positively charged amino acids are located in the inner (intracellular), while extremely rare in the outer (extracellular). 465
Xian Wen Luo and Zuo Ying Liu J. Chem. Pharm. Res., 2013, 5(9):465-471 ______________________________________________________________________________ Fig 1.1 Topology model of Rhodopsin. Hydrophobic residues are shown in yellow circles and positive-charged residues are shown in red circles These two features of the spiral membrane proteins provide a basis for the prediction of the topology structure of transmembrane protein. The first feature is applied to the prediction of transmembrane regions, while the second feature makes it possible to predict the transmembrane direction. The following topology prediction methods are developed on the basis of these two features. 2. Basic theories 2.1 Fuzzy set theory The concept of fuzzy set is first proposed in 1965 by Chad, a expert in cybernetics in California University. The emergence of the concept “fuzzy sets” makes it possible to use the mathematical thinking and methods to handle fuzzy phenomenon, which constitutes the basis of fuzzy set theory. Fuzzy sets can be defined as follows: suppose a mapping is given in a domain U, 2 1 : [0,1] | ( ) - A U u A u then A is the fussy set in domain U, A (u) is called the membership function of A or the membership degree of u to A. For simplicity, "Fuzzy " is recorded as "F", that is, "fuzzy sets", is written as "F set.”. In objective things, the most common is the case in which a real number R as the domain, the membership function of F set on R is called F distribution. According to the nature of the problem, the appropriate distribution (ie in line with the actual situation) can be selected, then the determination of the membership function is very simple. Starting from the actual situation of the transmembrane protein, apparently the distribution can meet the trapezoidal distribution. ( , , , ) A a a a a its membership function is defined as 0 x a x a a x a a a a x a a x a x a a a a x For transmembrane proteins, the interval (0, 1a, amino acid sequences of this interval belong to the transmembrane region is gradually increasing. The [ , ) a a indicates that the amino acid sequence in this region must belong to the transmembrane region, [ , ) a a indicates that the membership degree to which the amino acid 1 2 3 4 For the trapezoidal fuzzy number 1 1 1 2 2 1 1 2 2 - 2 3 A 4 3 4 4 3 0 4 1 a) indicates the amino acid sequence which does not belong to of the 2a) indicates that the membership degree to which the transmembrane region, its membership is 0. Interval [ 2 3 interval and its membership degree is 1. The interval 3 4 4a sequences of this interval belong to the transmembrane region is gradually decreasing. The area greater than indicates the amino acid sequence is sure not to belong to of the transmembrane region, its membership is 0. 466
Xian Wen Luo and Zuo Ying Liu J. Chem. Pharm. Res., 2013, 5(9):465-471 ______________________________________________________________________________ 2.2.Brief introduction to the operator IOWA Induced ordered weighted average (on IOWA) operator [15] was proposed by Yager, which is the expansion of induced weighted average (OWA) operator [16]. By empowering in order each time point in the sample interval according to the accuracy degree of each prediction method and taking the error sum of squares as a criterion, a new combination forecasting model is established. It is defined as follows: , , , , , , m m v a v a v a is m-dimensional array, and m f v a v a v a a wf is m-dimensional induced ordered weighted averaging operator resulting from iv is called the induced valueof ( , W 1 1 2 2 suppose ( , , , , , ) 2 3 - 1 1 2 2 ( ) w m m i v index i 1 i , , , v v v 1 2 then , m ia. , v index i )T m is the weight vector in OWA , meet. ( ) is the subscript of listing i large abbreviated as IOWA, , number arranged in descending order , m i 2.3 The data fusion algorithm The data fusion algorithm uses the information contained in the data itself to avoid the pre-set threshold, thereby reduces the subjectivity of the algorithm and improved its operability. The relative distance between the data is d , and its form is expressed as | | - ij i j d x x 2 4 d is, the smaller the degree of mutual support between the two data is. And then ijr which satisfies two conditions by itself: ijr is inversely proportional to the relative distance; (0,1] enables data processing to take advantage of the advantages of membership function in fuzzy set 1 2 1, 0, 1,2, , m i i . 1 i ij defined as ij The form shows that the larger define a support function ① ijr ② ijris defined theory, to avoid the absoluteness of the mutual support degree between data. Then the support function as d r d For the data fusion problem, establish the support matrixR r r r r r r R ij 1 2 5 - ij max{ } ij 11 12 1 n 21 22 2 n 2 6 - r r r 1 2 n n nn n 1 i If a message can be shared by a number of sub-systems, then i should integrate the overall information of 1 i , , , r r r ,by the merge theory of the probability of source, 1 2 i i in 467
Xian Wen Luo and Zuo Ying Liu J. Chem. Pharm. Res., 2013, 5(9):465-471 ______________________________________________________________________________ , , , v v v to meet the equation 1 2 which requires a group of non-negative v r v r n 2 7 - n in v r 1 1 2 2 i i i Rewrite the form into a matrix, then W RV 2 8 - ijr [ 0 T , , , ] , [ , v v , , ] W V v In the matrix, matrix. According to the property of non-negative matrix, R has the maximum modulus eigenvalue From V RV , its corresponding eigenvector can be obtained v v v v is the weight coefficients of numberi measured datum, and the integrated results of n measured data are 2 10 1 1 2 2 + - n n x x x x 3. New prediction method 3.1. Data sets and basic algorithm MPtopo is a transmembrane protein database, it stores the amino acid sequence of the transmembrane protein in the known topology structure. In this article, 124 amino acid sequence are used. They were divided into 10 groups and 10-fold cross-validation is carried out, and nine of them as a training set and one of them as a test set in turn. To integrate different algorithms, five kinds of transmembrane protein prediction algorithm will be used as a basis, they are OCTOPUS、PRO-TMHMM、PRODIV-TMHMM、SCAMPI-mas and SCAMPI-seq. 3.2 Model establishment For the same membrane protein sequences, there exist some differences in prediction results of the five kinds of transmembrane protein prediction algorithm, and these differences emerge in the boundary of amino acid sequence of transmembrane protein. It is necessory to integrate the results of the five kinds of transmembrane protein , , so the support matrix is a non-negative 1 2 1 2 n n 0 . ]T [ , v v , , V v . Suppose 1 2 n i 2 9 - i 1 2 n Then i tx.then tx prediction algorithm. Suppose the value of the amino acid sequence of real transmembrane protein is indicates the prediction result of the t time of the prediction algorithm i. 1 | | |( )/ | 1 -1 0 |( )/ | 1 t it t x x x i t N itk indicates the prediction accuracy of the t time of the prediction algorithm i, apparently itk as the induced value of the predictive value t time of a single prediction method in i kinds and its corresponding predicted values for constitute a five , , , , , t t t t k x k x k ( , , , )T W is ordered weighted averaging vector of various forecasting methods in x x x x x t it t it t 3 k it 1,2, ,5 1,2, , itk [0,1] then . itx , so that the prediction accuracy of the Take prediction accuracy . , x 1 1 2 2 5 5 t t two-dimensional arrays: 1 2 5 Suppose , , , k k k of the t time of the five kinds of 1 2 5 t t t combination forecast, list the prediction accuracy sequences 468
Xian Wen Luo and Zuo Ying Liu J. Chem. Pharm. Res., 2013, 5(9):465-471 ______________________________________________________________________________ k index it ( ) individual prediction method in descending order, set the t time of number i, according to the definition of induced ordered weighted average (on IOWA) operator, set 5 ( , , , , , , ) - t t t t t t i k index it i , then equation 3-2 is called the predictive value of the induced ordered weighted averaging combination resulting from the prediction accuracy sequence. Obviously equation 3-2 has nothing to do with individual prediction methods, but with the size of the prediction accuracy of the individual prediction methods at each time point. e x x then the error sum of squares S of 5 combination of prediction is: 5 5 5 5 5 2 ( ) ( ) ( ) 1 1 1 1 1 i i i j i The new forecasting model of induced ordered weighted average combination can be expressed as the following model: 5 5 5 min ( , , , ) ( i j k index it i j i 5 1 . . 0, 1,2, ,5 i i MATLAB optimization toolbox can be used to calculate the optimal weight The above formula can be used to obtain the prediction interval [c1,d1],[c2,d2],…[ct,dt] after the new integration of transmembrane protein. Then compare and the actual interval of the transmembrane protein[c1,d1],[c2,d2]…[ct,dt] to get a fuzzy interval number of the fusion. The same method can be used to deal with the right border range. Table 3-1 shows the training results of 124 transmembrane protein. Table 3-1 Training result 2 3 First fold 0.3553 0.2964 0.1614 Second fold 0.4017 0.3315 0.1087 Third fold 0.3925 0.3311 0.1158 Fourth fold 0.3792 0.3203 0.1304 Fifth fold 0.3933 0.3335 0.1152 Sixth fold 0.0616 0.5201 0.1761 Seventh fold 0.3916 0.3285 0.1119 Eighth fold 0.4491 0.3457 0.0882 Ninth fold 0.3871 0.3397 0.1145 Tenth fold 0.3921 0.3313 0.1144 Thus, for the boundary [ , ] new interval [ can be created. Because there are five kinds of different transmembrane protein prediction algorithm, five [ , , , ] a c a b b d . . [ , , , ] a c a b b d will be established. The final interval of the transmembrane protein [ can be obtained by using fusion algorithm. Obviously, the boundary of the interval of the transmembrane protein is in line with a trapezoidal distribution of the F distribution in the fuzzy theory. Its membership functions are as follows: as the subscript of the prediction accuracy of 3 2 IOWA k x k x k x x 1 1 2 2 5 5 ( ) 1 ( ) ( ) k index it t k index it Set k index it x ( ) ( ) 3 3 - S x k index it e k index jt e t i i j ) - S e k index jk e 3 4 1 2 5 ( ) ( ) 1 1 1 i s t 1 i 0.1191 0.0897 0.0963 0.1036 0.0952 0.1460 0.1028 0.0714 0.0940 0.0951 0.0678 0.0684 0.0643 0.0665 0.0638 0.0963 0.0652 0.0456 0.0646 0.0671 Training set Fuzzy interval 1 4 5 [-1.6383,3.5594] [-3.6303,1.7208] [-3.5933,1.5888] [-3.3487,1.6852] [-3.2849,1.5970] [-3.4707,2.3367] [-1.6284,3.2861] [-2.7480,1.4053] [-3.2667,1.6763] [-3.5077,1.6225] a b of a predicted transmembrane protein interval, there is a fuzzy interval[ , ] ] d c d. So, a i i , , , i c a b b a i i i new transmembrane ] d . intervals ] d [ , , , ] [ , , , [ , , , a c a b b d a c a b b a c a b b 1 1 1 1 2 2 2 2 3 3 3 3 4 4 4 , , , 4 . ] a c a b b d 5 5 5 5 469
Xian Wen Luo and Zuo Ying Liu J. Chem. Pharm. Res., 2013, 5(9):465-471 ______________________________________________________________________________ 0 ( )/ ( ) 1 ( )/ ( ) 0 x b d When an appropriate threshold is determined, it can go fuzzy. In this paper, the threshold is set to 0.5, and the helix direction of the transmembrane depends on the majority of the results of the five kinds of prediction algorithms. 4.Tests and results analysis 4.1 The topology prediction accuracy of transmembrane protein sequence If the transmembrane region of a protein sequence and their transmembrane directions are predicted correctly, the topology prediction of the entire protein sequence is correct. The topology prediction accuracy of the entire transmembrane protein sequence is expressed as follows. / T Tcor P P N N N indicates the total number of membrane protein, and membrane protein topology is correctly predicted. 4.2 Performance evaluation of Test set Table 4-1 shows the results of each test set, the algorithm described in this paper and is given the maximum value in indicator C and of the prediction algorithm ranked the second after PRODIV-TMHMM, simply compare the exact number of transmembrane domains whose prediction are accurate, you can find only three gap. Meantime, Table 4-1 shows the index value of the algorithm is the highest. Table 4-1 Prediction accuracy of transmembrane regions and topology N SCAMPI-seq 441 485 465 90.93% SCAMPI-msa 451 485 474 92.98% PRODIV-TMHMM 454 485 492 93.60% PRO-TMHMM 450 485 473 92.78% OCTOPUS 451 485 472 92.89% Proposed 451 485 470 92.99% x a a b a c c x x a c a a c a A x x b b ( ) X b d x b d b d N P Tcor In the equation, indicates the number of Q , indicating that the prediction of this algorithm is effective. Although the indicator M P N N Q N N TP Algorithm M C prd cor obs P P Tcor 77 80 76 74 79 81 94.84% 95.15% 92.28% 95.14% 95.55% 95.96% 92.86% 94.16% 93.04% 93.95% 94.21% 94.46% 124 124 124 124 124 124 62.10% 64.52% 61.29% 59.68% 63.71% 65.32% Figure 4.1 Prediction accuracy of transmembrane regions and topology 4.3 Analysis of the results 10 groups of transmembrane protein range are used for training as the training set, the weights of the five kinds of algorithms given by procedures are 0.41,0.5,0.08,0.01,0 and the fuzzy interval is [-0.58,2.16]. To predict the five 470
Xian Wen Luo and Zuo Ying Liu J. Chem. Pharm. Res., 2013, 5(9):465-471 ______________________________________________________________________________ transmembrane region with the weights of the five algorithms and the fuzzy interval, the results are shown in Table 4-2. Table 4-2 Comparing the predicted with the real Serial number Predicted value 1 [27.31,47.39] 2 [79.71,99.71] 3 [83.37,103.37] 4 [51.77,71.77] 5 [135.87,155.87] In the evaluation, it is generally believed that as long as there are nine residues coincidence between the predicted and known transmembrane region, this forecast is correct. It can be seen the remaining four groups have predicted accurately except group 1. The inaccuracy of group 1 is caused by the inaccuracy of the results given by the five basic prediction algorithms. Thus the correctness of the algorithm can be seen. CONCLUSION In this algorithm, the author takes the boundary of the transmembrane interval of the transmembrane protein as a fuzzy area, and uses the five prediction algorithms as the basis for integration and learning, then applies the results of learning to prediction. Because of the different principles of the five kinds of prediction methods and their complementarity to certain degree, higher prediction performance can be obtained by putting the predicted results of the different methods for effective integration, while the final results of this algorithm also proves this point exactly. Another characteristic of this algorithm is the introduction of fuzzy theory. This algorithm uses known trapezoidal membership functions to set different membership degree threshold to get corresponding predictions, thereby improving the flexibility of the forecast REFERENCES [1]Y. Deng, Q. Liu, X. Li, Acta Chimica Sinica, 2004,62(19):1968~1972 [2]G. von Heijne, Journal of Molecular Biology, 1992,225(2):487~494 [3]M. G. Claros, G. von Heijne, Computer Applications in the Biosciences, 1994,10(6):685~686 [4]D. T. Jones, W. R. Taylor, J. M. Thornton, Biochemistry, 1994,33(10):3038~3049 [5]B. Rost, R. Casadio, P. Fariselli, Refining neural network predictions for helical transmembrane proteins by dynamic programming, Proceedings of the 4th International Conference on Intelligent Systems for Molecular Biology, 1996,:192~200 [6]X. Deng, D. Wei, Y. Li, Y. Zhang, B. Kang and Y. Deng, Journal of Information and Computational Science, 2011,9(2):361~368. [7]L. A. Zadeh, Fuzzy sets, Information and Control, 1965,8(3):338~353 [8]Y. Deng, Cybernetics And Systems, 2011,42(4):246~263 [9]Y. Deng, Y. Chen, Y. Zhang, and S. Mahadevan, Applied Soft Computing, 2012,12(3):1231~1237 [10]Y. Deng and F. T. S. Chan, Expert Systems With Applications, 2011,38(8):9854~9861 [11]Y. Deng, R. Sadiq, W. Jiang and S. Tesfamariam, Expert Systems With Applications, 2011, 38 (12):15438~15446 [12]D. Wei, Y. Deng, Y. Li, Y. Zhang and S. Tang, ICIC Express Letters, Part B: Applications,2012,3(1):83~90 [13]R. R. Yager, Fuzzy Sets and Systems, 2003,137(1):59~69 [14R. R. Yager, IEEE Transactions on Systems Man and Cybernetics, 1988,18(1):183~190 Real value [15,45] [77,103] [84,111] [49,67] [131,154] 471