Download
1 / 26
260 likes | 276 Views
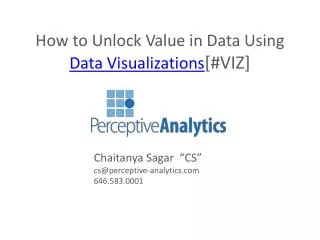
We are a Data Visualization company passionately committed to helping our clients to create solutions that work in the real world.

E N D
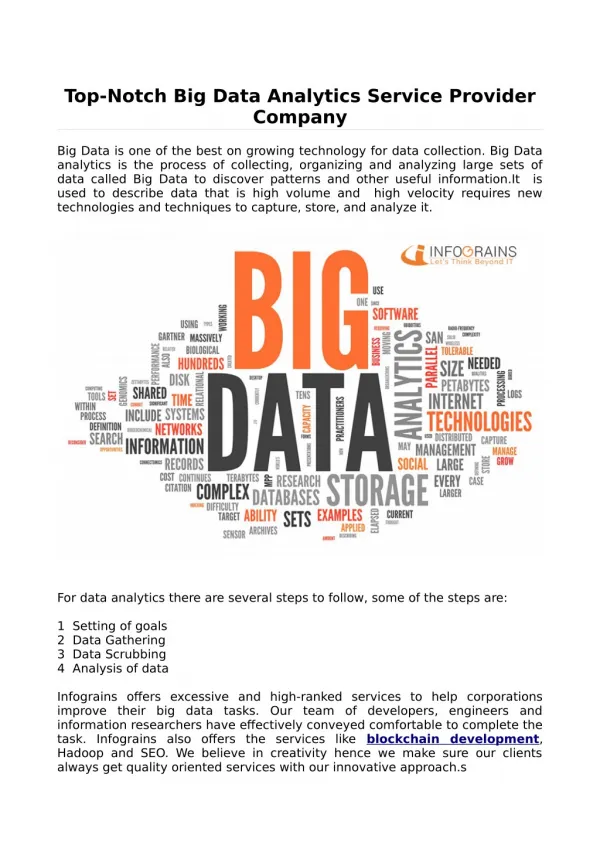
Make your data more insightful, Visually Unlock the power of your data. Make informed decisions anytime-anywhere to deliver successful business outcomes
7+ Years of Solution Delivery 15+ Domains Served Who We Are We're a Data analytics firm passionately committed to helping our clients using leading-edge analytics, technology, and strategy to create solutions that work in the real world 200+ Projects Completed 10K+ Dashboards Delivered 200K+ Hours of Consulting We are Microsoft Partner company
Our Esteemed Clients Since 2015, we’ve helped 40+ clients create a data-driven culture with Business Intelligence solutions
Tools & Technologies We work in all major BI tools and constantly develop our knowledge to provide clients with the best solutions tailored to their needs
Our Visualization Services And Offerings
Data-driven Transformation Build a technology-driven data culture for people to value, practise and encourage the use of data for improved decision making IT Strategy Consulting Create a roadmap to develop an IT strategy centred on your business’s needs, innovation, practices and scalability Strategy & Consulting Data Strategy and Architecture Create a blueprint of processes and practices to capture business requirements and translate them into an integrated data environment Data-centric Marketing Strategy Build marketing strategies with the use of customer insights to drive targeting & positioning for better market presence We’ll build a strategy to solve complex business problems, finalize the data-culture you need and anticipate, predict, expand growth opportunities Delivery & Execution Strategy Integrate project delivery strategies and execution plan to successfully deliver highly complex and challenging projects within time Data Governance & Privacy Get expert’s help on compliance and data governance while enabling you to collect and manage sensitive data to gain valuable insights
Data visualization consulting Design, develop & deliver dashboards for data-driven decision making with our data visualization consultants Visual analytics solutions Integrate visual analytics solutions throughout your organization to make your decision-making process faster, easier, and efficient Data Visualization Innovative solutions Build scalable, out-of-the-box & innovative solutions for all the ad-hoc problems with our expert engineering team Performance optimization Identify the exact reasons impacting your dashboard performance and fix them with our optimization experts We partner with you to develop everything from an integrated visualization strategy to building delivery capabilities for all your visualization needs Ready to use solutions Use our ready-to-use, flexible and scalable visualization solution to complete your projects in no time Extended team of BI consultants Get dedicated technical, functional, and Techno-functional experts to scale up your analytics capabilities
Data Modelling Strategically collaborate with us to design, build & deliver data models compatible to your business analytics needs Data Quality Management Use our standardized, well-defined data patterns, and proven frameworks to monitor quality of your data Data Preparation Master Data Management Implement a centralized MDM strategy and enable the entire organization to organize, categorize, and utilize their data Data Migration Services Design an end-to-end data migration strategy, with assessment, planning, and process optimization We can help you undergo a data-centric digital transformation with an integrated data processing strategy across the entire enterprise Data Transformations Choose from our wide range of services, from strategy and advisory support to fully managed data transformations Extended team of BI consultants Get dedicated technical, functional, and Techno-functional experts to scale up your analytics capabilities
Design Strategy Define your design strategy & standards at organization level to bring design consistency, efficiency and uniqueness Dashboard Designing Turn your data into a compelling story with design rich BI dashboards in a user-friendly, interactive format Dashboard Designing Data Storyboards Convert your messy data points in a visually appealing and interactive storyboard for better decision making. Infographics Designing Turn your lengthy excel files and PowerPoint presentation into visually appealing info-graphic designs We can help you transform your lengthy excels & messy data into eye-catchy and informative dashboards and make a long-lasting impression Dashboard UI/UX Focus on user behaviour to bring intuitive designs that fit all the devices and help users make informed decisions Extended team of BI consultants Get dedicated technical, functional, and Techno-functional experts to scale up your analytics capabilities
Story Boarding Strategically collaborate with us to design, build & deliver data model compatible to your business analytics needs Data Storytelling Ready to use solutions Use our ready-to-use, flexible and scalable storyboard solutions to convey your business insights Storyboard UI/UX Focus on user behaviour to bring intuitive designs that fit all the devices and help users make informed decisions We can help you get the most value from your data, and enable your team drive transformational change through all levels of your organization with storyboards Report Automation Automate all your reports and directly send personalized story boards on email instead of cluttered dashboards
BI Consulting Strategically design business intelligence implementation services by leveraging cutting-edge BI platforms BI Implementation Move your traditional decision-making system to an integrated data-driven business intelligence environment that is sustainable, scalable, and cost-effective BI Implementation Data Visualization & Reporting Design, develop & deliver dashboards for data-driven decision making with our data visualization consultants We optimize the data collection, transformation, and data analysis processes using the best BI tools and technologies for better decisions based on relevant, timely, and accurate information Data Migration Services Design an end-to-end data migration strategy, with assessment, planning, and process optimization Tool based Implementation Implement tool-based solutions using industry leading tools like Tableau, Power BI, MicroStrategy, Dundas BI Extended team of BI consultants Get dedicated technical, functional, and Techno-functional experts to scale up your analytics capabilities
Effective Finance Data Analysis We redesigned the finance data management & analysis for a large manufacturing company to analyze the financial details effectively Know More
Simplified cycle hire analysis Automated dashboards for tracking of bikes, stations, usage, & analyzing bike usage pattern Techknomatic implemented a custom bike tracking & utilization solution for an Asian bike rental services company and boosted their bike availability by 12% in 3 months Know More
HR Management Through Instructive Dashboards At Techknomatic, we create simple and clean dashboard that are entertaining, intuitive, and feature-rich visualizations to provide organizations with actionable insight. We assist you in identifying more effective methods to visualize your data and creating visuals that stand out. Know More
Effective E-Commerce Order Analysis Tracking of online & offline business, inventory, & finance using executive dashboards. We revamped the business tracking mechanism for a large shoe manufacturer to analyze the online/offline business metrics efficiently Know More
Insurance Claims Executive Dashboards Analyze Gross Paid Loss, Credits, 3rd Party Expenses, salvages. We helped our client assess how much they pay out in claims, with what frequency, loss ratios relative to premiums coming in. Know More
An Insurance Giant Through its Life Insurance Dashboard Analysis Analyze sum assured, annual premiums, claim amounts, and total policies Know More
How Techknomatic’s Dashboards Helped A Call Centre For Improving Claim Efficiency Analysis Analyze Claim ticket frequency, current status, & their priorities for evaluating call center efficiency Know More
Recruitment Data Analysis Unlock the Power of Your Recruitment Data with Techknomatic’s Interactive Dashboards Know More
Insurance Agent Attrition Analysis We helped our client leverage its business data to monitor key KPIs across the organization and enabled business users to make data-informed decisions with intuitive dashboards Know More
Oil Processing Operations Analysis Our client can now efficiently make data-driven, time-variant, and informed decisions with Techknomatic’s Dashboards Know More
Logistics & supply chain Human Resources Insurance Industries We Work With Retail & E-commerce Pharmaceuticals Oil & Gas Industry Education & Training FMCG IT & ITES
Our internal team created 15-20 dashboards for our internal operations platform. We contacted Techknomatic to re-designing these dashboards for better UI. The re-designed dashboards by the Techknomatic team were eye-catchy, attractive aa well as intuitive. This team understands the user experience and dashboard design very well. The Techknomatic team understands the visualization space very well. They have helped us in building a visualization layer on top of our Data processing solution. Our clients loved the visualization created by the Techknomatic team. The combination of UI & UX with justification to each chart, color selection was very thoughtful and convincing. BI Head IT Consulting Firm - Singapore Sazinga Digital CEO Client Reviews Techknomatic is one of exemplary partner demonstrating “Constant Innovation, Courage over Comfort, efficacy towards sharing right talent for delivering out-of-box analytical solutions”. Impressive to see the exponential growth of Techknomatics in terms of expertise across varied skillsets and people headcount. Techknomatic has supported us in all the visualization needs from environment setup to delivering dashboards for our CXOs. They have become part of our delivery team and help us in every step of our project strategy, delivery and support. Delivery Manager Sales and Marketing consulting firm Analytics Head Fintech Company – India
Pune 3rd Floor, Srushti Elegance, near Dot Fit Gym, Baner, Pune, Maharashtra 411045 Mumbai 115, Lodha Supremus II, Wagle Estate , Thane (W), Maharashtra, Mumbai - 400604 Our Offices Singapore 111 Somerset Road, #15-18 Somerset, Singapore 238164
Thank You linkedin.com/techknomaticservices facebook.com/techknomaticservices twitter/techknomaticservices ? ? ? info@techknomatic.com 91 98226 83356 ? ? www.techknomatic.com