Download
1 / 22
230 likes | 579 Views
Exchange Rates and International Trade. Market for U.S. dollars Comparative advantage Free trade U.S. balance of payments. Import & Export Sales and Exchange Rates. The international competitiveness of products can be affected by exchange rates .

E N D
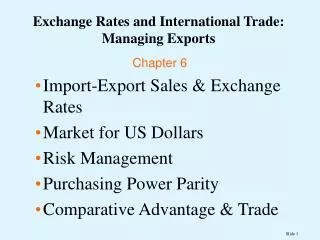
Exchange Rates and International Trade • Market for U.S. dollars • Comparative advantage • Free trade • U.S. balance of payments
Import & Export Sales and Exchange Rates • The international competitiveness of products can be affected by exchange rates. • Cummins Engine, a US exporter, faces a problem when the dollar strengthens in value. • Their engines become more expensive to foreign purchasers, if they keep the dollar price of engines constant. 1999 South-Western College Publishing
Foreign Exchange Terminology Language used depends on exchange rate regime: floating or fixed Appreciates or Depreciates-- Under Flexible FX Rate Regimes Revalues or Devalues-- Under Fixed FX Rates Spot Pricefor FX -- current price (2 day delivery) Forward FX Price -- currency price for future delivery 1999 South-Western College Publishing
Exchange Rates (1998)DM Spot and Forward Rates Country US $ equivalent Per US $ Thurs. Wed. Thurs. Wed.Germany (DM) .5562 .5576 1.7981 1.7985 30 day forward .5571 .5585 1.7951 1.7905 90 day forward .5589 .5604 1.7892 1.7845 180 day forward .5616 .5631 1.7805 1.7760 1999 South-Western College Publishing
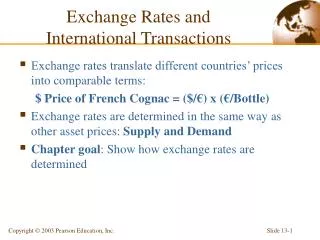
Supply & Demand Model of Exchange Rates DM • FX is used for trade and investment. Use a supply & demand model to explore FX rates • Demand for Marks: Demand is associated with US demand for imports from Germany and purchase of German securities $/DM D DM
We expect that as the price of German products to U.S. customers goes down, there will be greater demand for DM. • As the dollar has more purchasing power in Germany (at point B), Americans will want more Marks. $/DM A B DM
Supply of DM & Market Clearing in FX S1 • Supply of DM -- Supply is associated with German demand for US exports and US investments. • Market Clears-- no excess demand or excess supply of DM • In Flexible Markets, buying & selling through international banks $/DM D DM
SUPPOSE: There is a rise in the Inflation Ratein the US S' S • Both Supply & Demand of DMShift • German products appear cheaper • US exports appear more expensive • The Mark appreciates, and the dollar depreciates $2/DM $1/DM D' D DM
Exchange Rates: One Year Changes in ‘97 52 Wk High52 WK LowClose%Change 52 Wks British Pound in US$ $1.71 $1.50 $1.657 +7.96% Canadian Dollar in US$ $0.75 $0.71 $0.703 -4.5% Swiss Franc Per US$ 1.49 1.19 1.44 -15.30% or $0.67 $0.84 $.69 (it was at $.81) Japanese Yen Per US$ 131.33 104.59 130.2 -18.09% or $.0079 $.0096 $.0077 (it was at $.0094) German Mark Per US$ 1.73 1.47 1.78 -15.15% or $0.58 $.0.68 $0.56 (it was at $0.66) 1999 South-Western College Publishing
Cross Rates: Dow Jones TelerateInterbank for $1 million or more (1998) US Dollar Pound Yen D-Mark Canada 1.4362 2.3913 .01103 .79873 France 6.0300 10.040 .04633 3.3535 Germany 1.7981 2.9938 .01381 --------- Italy 1777.0 2958.7 13.652 988.27 Japan 130.16 216.72 --------- 72.388 Mexico 8.4670 14.098 .06505 4.7098 Netherlands 2.0234 3.3690 .01555 1.1253 Switzerland 1.4897 2.4804 .01145 .82849 U.K. .60060 --------- .00461 .33402 U.S. --------- 1.6650 .00768 .55614 Upper triangle(above dashed lines) are in home country as in 130 yen for a dollar, ¥/$. Lower BOLD triangle areinforeign currency as in less than a penny a yen, $/¥
Market makers earn their profit on the spread Bid - AskSpreads ASKprice price willing to sell Bid price price willing to buy .66627 .66539 1999 South-Western College Publishing
Key Currencies & Cross Rates B A C D • Markets develop in each pair of currencies • If there are N=4 countries, there are as many as N•(N-1)/2= 6 different possible FX rates • With the US as a Key currency, can reduce the number to only 3 • For hundreds of countries, chief or key currencies is natural 1999 South-Western College Publishing
Exchange Rates, Cash Flows, & Risk • Economic Exposure (or Risk) involves the impact of exchange rates on a firm’scash flows • Economic decisionsshouldincorporate expectations about future exchange rates. • Firms may self insure by accepting these risks • or they may buy foreign exchange insurance via entering into contracts such as forward contracts. 1999 South-Western College Publishing
Types of Hedges • Internal hedges – multinational firms buy and sell within the firm in any currency that they select. • Hedges using forward contracts – firms can offset exposure in foreign currency by buying or selling that amount of currency in a forward contract. • Hedges using future contracts – firm may offset risk with a futures contract in that currency. • Hedges using currency swaps – firms may agree to exchange (swap) streams of payments in different currencies, with adjustments at each settlement date. 1999 South-Western College Publishing
Asset - LiabilityManagement for Exchange Risk • One simple approach to reduce exchange rate exposure is to structure parent and subsidiaries such that exchange rate changes affect assets and liabilities in tandem. • Method:Suppose that percent of the business exported to country X, the firm could borrow the percentage in the currency of country X. • Hence, financing is a convenient way to arrange forms of hedging “revenue” assets. 1999 South-Western College Publishing
Exchange Risk & Stockholders • Eliminating all exchange risk may not be in the interest of shareholders. • If shareholders are well diversified, they may not be particularly sensitive to unsystematic variations due to changes in exchange rates and "exchange risk", especially if reducing that risk sacrifices profits. 1999 South-Western College Publishing
Long-Run Exchange Rate Determinants 1.Countries tend to have declining value of their currency when they run trade deficits, and tend to have rising currency values if they run trade surpluses. 2.Long-run trends in exchange rates are affected by differences in inflation-adjustedinterest rates. High relative interest rates attract investors, tending to raise the value of the currency. 3.Countries with highinflationtend to depreciate; countries with low relative inflation appreciate. 1999 South-Western College Publishing
Purchasing Power Parity (PPP) • Purchasing power parity says that the price of traded goods tends to be equal around the world. The law of one price. • if exchange rates are flexible and there are no significant costs or barriers to trade. S11 + (h ) S0 ( 1 + f ) S1/ S0 shows the expected change in the direct quote of a currency. The right side of the equation is the ratio of home and foreign inflation rates. If the foreign inflation rises (f), then the domestic expected future spot rates S1declines. = 1999 South-Western College Publishing
Problems (or qualifications) with relative PPP: • PPP is sensitive to the starting point, S0. The base time period may not in equilibrium • Differences in the traded goods, or cross-cultural differences, may make prevent the law of one price to equilibrate price differences. • The inflation rate may include non-traded goods. • PPP tends to work better in the long run than in short run changes in inflationary expectations. 1999 South-Western College Publishing
International Trade and Trading Blocs • Countries restrict trade through tariffs, quotas, and currency restrictions. • Several regions have reduced trade restrictions • MERCOSUR (in South America) • NAFTA (in North America) • EU (the European Union, or often the European Community) • looser arrangements in Southeast Asia (ASEAN) • APEC throughout the Pacific area including the US, Mexico, and Canada. 1999 South-Western College Publishing
Comparative Advantage • Countries or firms should produce more of those goods for which they have lower opportunity cost. • Relative Cost in US Relative Cost in Japan • Automotive carburetors .4 Chips 1.25 Chips • Computer Chips 2.5 Carburetors .8 Carburetors • It costs $120 in the US to make a carburetor and $300 to make chips, the “cost” of a carburetor is the .4 chips foregone (take the ratio $120/$300 to find .4 chips). • The US relative cost of carburetors is much lower than that of the Japanese (1.25 Chips), whereas the Japanese relative cost of chips (.8 Carburetors) is much lower than that of the US. Japan should make chips and US should make carburetors. 1999 South-Western College Publishing
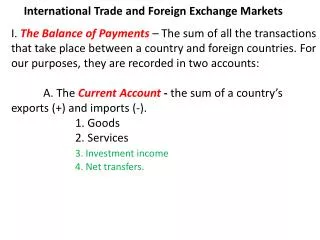
Trade Deficits and the Balance of Payments • Current account = goods and service trade flows, receipts and payments US assets abroad and foreign assets in the US, and unilateral governmental and private transfers • Capital account = capital inflows and outflows of foreign assets. • The current account (deficit or surplus) comes from a capital account (surplus or deficit) to balance payments. This is the idea behind the accounting identity of the balance of payments. 1999 South-Western College Publishing