Download
1 / 13
220 likes | 1.26k Views
Mass Spectrometry. sample ion plot intensity ( I ) vs. mass-to-charge ratio ( m/e ) mass spectrometer ––– ion source , analyzer , detector ion source M [M‧] + neutral and positively molecular ion charged fragments

E N D
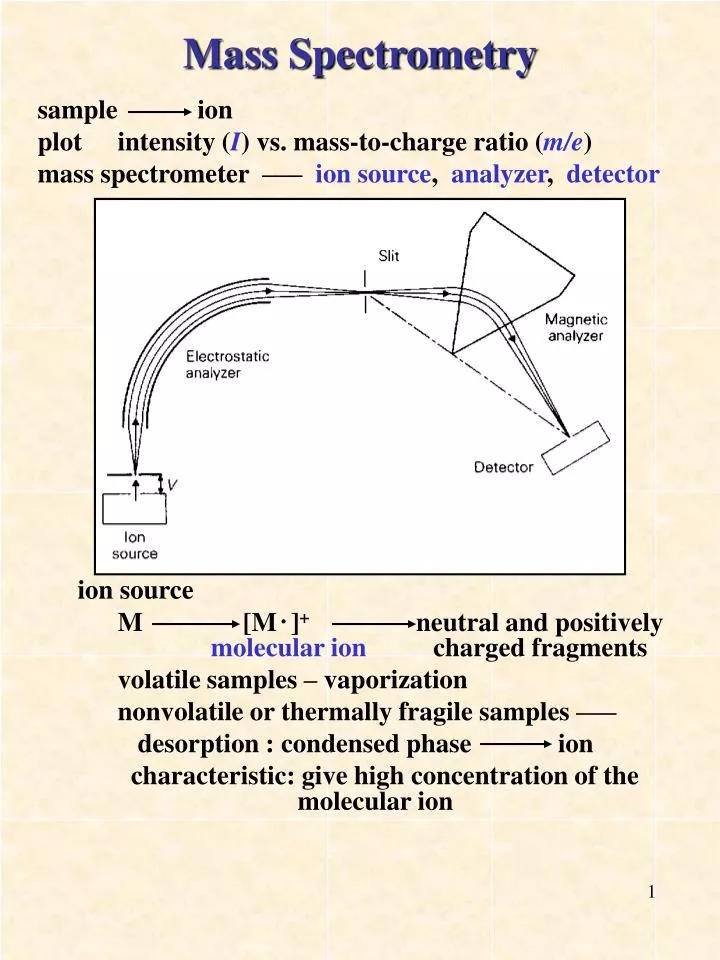
Mass Spectrometry sample ion plot intensity (I) vs. mass-to-charge ratio (m/e) mass spectrometer ––– ion source, analyzer, detector ion source M [M‧]+ neutral and positively molecular ion charged fragments volatile samples – vaporization nonvolatile or thermally fragile samples ––– desorption : condensed phase ion characteristic: give high concentration of the molecular ion
common ion sources name (abbreviation) type ionizing agent electron ionization (EI) gas phase energetic electrons field ionization (FI) gas phase high-potential electrode chemical ionization (CI) gas phase reagent positive ion or electron capture fast atom bombardment desorption* highly energetic neutral atoms (FAB) field desorption (FD) desorption† high-potential electrode (10-8 – 10-9 V/m) laser desorption (LD) desorption† laser beam plasma desorption (PD) desorption† high-energy fission fragment from 252Cf secondary ion mass desorption† 1~20 keV ions spectrometry (SIMS) thermal desorption (TIMS) desorption† heat * sample as solids or solutions † sample as solids, gases or solutions electron impact (EI) M + e- M+˙ + 2e- M + ne- Mn+˙ + (n+1)e- fast atom bombardment (FAB) charged Ar or Xe atom higher chance of observing the parent ion matrix – glycerol chemical ionization (CI) CH5+ NH4+ AH+ + M A + MH+ m/e M + 1 M + 17 or M + 18 ([M+AH]+) thermospray mass spectrometer injection of an electrolyte solution through a heated capillary into a vacuumevaporation of solvent leave single positive and negative ion even dication can be detected e.g. [Me3N(CH2) 3NMe3]2+
analyzer electrostatic cause the ions to move in circle magnetic radii depend on m/e ratio of the ions kinetic energy eV = 1/2mv2 curved trajectory Bev = mv2/r m B2r2 ==> ―― = ――― e 2V spectrum plot of ion current vs. m/e ratio majority ― single positive charge ion integral mass values small number of doubly, triply charged ions molecular ion ― loss of an electron from the sample molecule, has the same mass as the parent molecule e.g. manganese carbonyl m/e = 390 ===> Mn2(CO)10 molecular ion (i) not necessary the strongest peak (ii) may not be visible (iii) can be increased by reducing the energy of the electron beam (iv) with ionization methods other than electron impact (particular laser desorption), the molecular ions are much prominent ==> measuring molecular weight
(v) with FAB ionization, sample is mixed with a mulling agent, usually glycerol positive ions are formed by protonation and appear with a mass of (M.W. + 1) anions are formed with mass of (M.W. –1) (vi) determining the mass of an ion to the nearest integer may not be good enough ex. an iron carbonyl complex with a molecular ion at 504 amu possible formula – Fe(CO)16, Fe2(CO)14, Fe3(CO)12, Fe4(CO)10, Fe5(CO)8 with high resolution instruments the atomic masses are not exact integers, it is possible to determine the masses of ions within a few ppm the exact masses for Fe3(CO)12 503.7438 amu and Fe4(CO)10 503.6889 amu isotope abundance pattern many elements have more than one isotopes, and if such elements are present in a compound ==> there will be not just one molecular ion, but a whole series of the pattern can be distinctive and diagnostic
ex. PFBr2 ReBr ReBr2 fragmentation excess energy (i) excited state molecular ion ――――→ (ii) new ion + neutral part the pattern of breakdown ==> measure parameters such as bond dissociation energy e.g. triatomic molecule ABC mass spectrum include [ABC]+, [AB]+, [BC]+, [A]+, [B]+, [C]+ ==> miss [AB]+ ==> the compound is A–B–C e.g. Re2Cl2(CO)8 a series of peaks corresponding to the molecular ion and ions showing successive loss of all 8 CO groups ==> Re2Cl2 hold together strongly the structure is
e.g. part of mass spectrum of Re(CO)5Br e.g. thio-ether ion [SnMe3O]+ is found in the mass spectrum ==> the structure should be not e.g. B2H6 e.g. TiCl4 + NaCp ―→ product
ion reactions it is possible to obtained direct information about ion reactions by observing the peaks associated with metastable ions metastable ions – the ions have such short lifetimes that they dissociate while moving through the spectrometer one ion (of mass m1) is accelerated after the initial ionization, but different ion (of mass m2) passes through the magnetic analyzer. the resulting peak comes at m* in the spectrum m22 m* = —— m1 the ions are formed during 10-5 seconds or so that they spend between the electrostatic and magnetic analyzers ==> they give quite broad spectral peaks ex. 4 normal ions and 1 peak arising from a metastable ion
ex. the mass spectrum of P(OPF2)3 5 weak peaks attributed to metastable ions the peak at 143.3 amu was attributed to [P(OPF2)3]+ (286 amu) and [P(OPF2)2]+ (201 amu) thermodynamic data ion [AB]+ decomposes to give [A]+ and B, the appearance potential of [A]+ is the sum of the ionization potential (IP) of A and the bond dissociation energy (BDE) of AB if the IP of A is known, BDE of AB may be derived BDE IP AB ―――→ A∙+ B∙――→ A+ + B∙ appearance potential of [A]+ = IP of [A]+ + BDE of [AB]
ex. dissociation of complex [Fe(h5-C5H5)(CO)L(MX3)] [MX]+ appearance MX3 IP Fe-M BDE potential (eV) (eV) (eV) (kJ/mol) [Fe(C5H5)(CO)2(SiMe3)] 9.22 7.25 1.97 190 [Fe(C5H5)(CO)2(SnMe3)] 9.12 6.81 2.31 223 [Fe(C5H5)(CO)2(SnPh3)] 8.87 6.29 2.58 249 [Fe(C5H5)(CO)(PPh3)(SiMe3) 9.48 7.25 2.23 215 ex. D ClCH2PH2 CH2=PH+ HCl C + H2 + P CH2=PH DHfo = ? IP of CH2=PH : 10.3 0.2 eV AP of [CH2=PH]+ from ClCH2PH2: 11.0 0.2 eV DHfo (HCl) = -92 kJ/mol DHfo (ClCH2PH2) = -44 4 kJ/mol standard heat of atomization: H, 218; C, 717; P, 315 kJ/mol standard single bond energy: C—H, 413; P—H, 321 kJ/mol estimate C=P bond energy ClCH2PH2 [CH2=PH]+ + e- + HCl DH = 11.0 0.2 eV (1061 20 kJ/mol) 1061 = DHfo([CH2=PH]+) + DHfo(HCl) - DHfo(ClCH2PH2) = DHfo ([CH2=PH]+) + (-92) - (-44) DHfo([CH2=PH]+) = 1061 + 92 – 44 = 1109 20 kJ/mol (10.3 0.2 eV) DHfo(CH2=PH) = 1109 – 994 = 115 30 kJ/mol
C + 3/2 H2 + 1/4 P4 CH2=PH (1 C=P + 2 C—H + 1 P—H) C + 3 H + P (218 x 3 + 717 + 315) – (2 x 413 + 321) – (BDE of C=P) = DHfo = 115 BD of C=P = -115 + (218 x 3 + 717 + 315) – (2 x 413 + 321) = 424 kJ/mol
mass-analyzed ion kinetic energy (MIKES) example ―→ ―→ C6F5PCl+ + C6F5S
tandem mass spectrometry multistage mass spectrometry (MS/MS) two major applications (i) it is a very powerful analytical tool for mixtures, working on picogram quantities, it is possible to distinguish between isomers (ii) it is a means of studying the (iii) decomposition of ion example MS/MS spectra for [(Me3P)2BH]+ (a) with 11B and (b) with 10B